This document provides background information on the statistical release ‘Participation in Education, Training and Employment by 16-18 year olds in England’. It explains the concepts and methods used to calculate the participation estimates and provides an overview of the data sources and other relevant information.
Participation in education, training and employment age 16 to 18
- Published
Introduction
Coverage
The data in this publication covers young people who reside in England, and is based on their academic age, that is their age at the start of the academic year, 31st August. The publication includes data on individual ages 16, 17 and 18 as well as for combined age groups, 16-17 and 16-18. The data is at national level only and cannot be disaggregated to sub-national levels, or by characteristics other than sex due to the methodology used.
Participation estimates are broken down by:
- (academic) age
- sex
- institution type
- whether full-time (FT) or part-time (PT)
- highest study aim.
This publication provides the most robust annual estimates of participation and NEET (not in education, employment or training) in England.
The publication also provides an estimate of the number and proportion of 16-18 year olds not in education and training (NET) and looks at the labour market status for both those young people identified as NET and those participating in education or training. Those identified as NET and not in employment are classified as NEET.
Local authority (LA) estimates of participation in education and work-based learning by 16- to 17-year-olds are not published as part of this statistical release. The Department for Education publishes transparency data for local participation based on local authority management information, here: Participation in education and training by local authority. (opens in new tab)
Data sources
| Data source | |
|---|---|
| School census | The school census is a statutory pupil level data collection for all maintained schools, including local authority maintained special and non-maintained special schools, academies including free schools (secondary free schools, studio schools and university technical colleges) and city technology colleges in England. The school census is collected on a termly basis with 3 collections per calendar year. This publication uses spring school census data collected in January and, for provisional data on post 16 learning aims, the autumn school census collected in October. The school census was first collected in 2006 for secondary schools only and then for all schools from 2007 onwards. Prior to 2007, the school census dataset was known as the pupil level annual school census (PLASC) and was collected once a year in January. Comprehensive PLASC data was first collected in 2002. Independent schools submit school-level data via the annual school level census (SLASC). In 2019, 384 schools did not submit or their entries were incomplete. As a result numbers were imputed using either the 2018 census or information from Get information about schools (GIAS). Further explanation of the 2019 data issues and imputation can be found in the release https://www.gov.uk/government/statistics/announcements/schools-pupils-and-their-characteristics-january-2019. |
| Schools returning the ILR | Sixth-form colleges in England have been able to apply to become a 16 to 19 academy since end 2015. These 16 to 19 academies established from sixth-form colleges continue to return the ILR as oppose to the school census. Therefore, from 2017 the ‘converter academies’ rows in the tables include both schools recorded as converter academies on the school census and sixth form colleges who were recorded as a converter academy on the Individualised Learner Record (ILR). |
| Further Education (FE) Institutions | The Education and Skills Funding Agency (ESFA) Individualised Learner Record (ILR) provides data on learners in FE sector colleges. The ‘FE college’ sector is mainly general FE, tertiary and specialist college provision, but also includes some publicly funded provision delivered through commercial, charitable and local authority providers. Snapshot data as at 1 November is used. The data used for provisional estimates is the annual SN06 freeze and for final estimates the SN14 freeze. The ILR data for the latest year is provisional and is scheduled to be revised in the following year’s publication (usually in June). Figures for previous years are final but can be updated following revisions to LFS or population estimates. |
| Work Based Learning (WBL)/ Apprenticeships | The ESFA ILR provides monthly data on young people on WBL programmes. Snapshot data as at 1 January has been used, for end 2001 onwards. |
| Traineeships | Due to relatively small numbers, traineeship numbers are included in the FE figures in the tables. |
| Higher Education Institutions (HEI) | Students in institutions of higher education on 1 December are included from data supplied by the Higher Education Statistics Agency (HESA). Some HEIs return ILR forms rather than send returns to HESA. They are permitted to do this as long as they do not do both but there are no checks to ensure duplication does not occur. In 2018 there were approximately 6,000 ILR records from HEIs, of which approximately 50% were academic age 18. Comparing the number of returns for the same institutions in the HESA data, to assess the volume of any potential overlap, we estimate very low volumes at ages 16 and 17. At age 18 it is more difficult to assess the potential overlap as both collections have substantial returns for that age group. However, in 2023 there were approximately 5,500 ILR records from Higher Education Organisations, of which approximately 40% were academic age 18, but these young people were all studying for qualifications below HE level. Since the HESA 2019/2020 data, there have been no qualifications below HE recorded so we can conclude that no duplication has occurred in recent years. From end 2022, the HEI rows in the underlying data now include these ILR higher education organisations rather than them being included within General FE colleges. This gives a more accurate breakdown of the highest qualification at level 3 and below in HEIs. |
| Labour Force Survey (LFS) | Figures on labour market status come from the average of Q4 (October to December) and Q1 (January to March) LFS data for each year. The LFS also supplies the non-HEI based data for Employer Funded Training (EFT) and for Other Education and Training (OET). The LFS is a quarterly survey of approximately 50,000 households in England however sample sizes have been falling in recent years. If an individual is not available for interview, another member of the household may respond on their behalf. ONS employment and labour market statistics See also weaknesses of the data section. |
| Population estimates | The population estimates for academic year ages in January of each year are derived by DfE from mid-year estimates and projections provided by the Office for National Statistics (ONS). Population estimates are subject to statistical uncertainties arising from sampling error and imputation effects when using census data, as well as from estimation of the components that age the population forward from the census date. It is routine for population estimates and projections to be revised following a new census. Detail on the population data methodology and revisions to the participation in education, training and employment rates can be found in the section: ‘Revisions to previously published published estimates’. |
Weaknesses of the data
Timeliness
The provisional annual figures are usually published in June, 6 months after the period to which they relate. There is therefore a lag of up to 18 months between the period to which the data relates and when it is next updated with final figures.
Population estimates
The data uses ONS population figures which are subject to error, which can increase as they move further away from the date of the census, particularly when looking at single age groups.
- Following the 2011 census: The 2011 population estimate was revised using Census 2011 which led to the population estimate of 16 to 18 year olds increasing by 4 percent which in turn caused the NEET figure to increase by 1.8 percentage points.
- Following the 2021 census: We have also seen changes following the 2021 census. Full details of the revisions, including to the back series can be seen in the section ‘Revisions to previously published estimates’.
Labour Force Survey
Employment rates for 16-18 year olds and participation in training not captured through DfE administrative data sources are estimated using the Labour Force Survey (LFS). LFS response rates have seen a decreasing trend in recent decades with a notably smaller sample in 2023 of just 2,400 16-24 year olds. As a result, additional caution should be taken when interpreting estimates. Further information on the LFS and how we use this data to estimate wider participation and NEET rates can be found in this methodology with additional information on sample sizes here: NEET age 16 to 24: methodology, Methodology – Explore education statistics – GOV.UK (explore-education-statistics.service.gov.uk)
Raising Participation Age (RPA) compliance measure
Currently this publication has no measure which accurately captures the numbers of young people who comply with the requirements of raising participation age (RPA) although trends can be estimated from the in education and apprenticeship figures.
Definitions
| Definition | |
|---|---|
| Academic Age | Age of a learner at the beginning of the academic year, 31 August. |
| Employer Funded Training (EFT) | Figures for EFT cover employees who have received training in the past 4 weeks; these figures are restricted to training other than WBL and exclude those who have previously received training in their current job, though not in the last 4 weeks. They cover only young people who are in employment. |
| Full time education (FTE) | The full-time education definition varies according to institution type. In schools, full-time learners study 10 sessions a week (1 session is half a day). In further education institutions: a) From 2013 a full-time learner is defined as someone enrolled on a programme of learning totalling 540+ planned hours per year, from either qualification guided learning hours (GLH) or employability, enrichment and pastoral (EEP) planned hours; b) Prior to 2013 full-time learners are defined as those enrolled on programme of learning of 450+ qualification guided learning hours per year, or at least 150 GLH per tri-annual period, or more than 16 GLH per week for shorter courses. In Higher Education Institutions, full-time learners study 21 hours a week for 24 weeks a year. |
| Part time education (PTE) | Where the mode of education is not classified as full-time, as in the above methodology, then it is assumed that the mode of study is part-time. In some ILR records the number of qualification guided learning hours (GLH) and employability, enrichment and pastoral (EEP) planned hours are recorded as NULL. These records are classified as part-time in the tables. Many of those ILR records with NULL hours are Private Ltd companies where study is likely to be part-time. |
| Labour Force Survey (LFS) | The LFS covers all residential households and nursing accommodation. Householders are asked to reply on behalf of students living away in halls of residence. The LFS excludes people outside such accommodation - chiefly hospital residents, people in prison, people in army barracks and the homeless. The LFS is a sample survey so all estimates of labour market participation are subject to sampling error, as are the estimates for the non-HEI (higher education institutions) based components of employer funded training (EFT) and other education and training (OET). |
| Labour market status | The definitions of labour market status used in this publication are the same as those in the Labour Force Survey (LFS), and follow the conventions promoted by the International Labour Organisation (ILO): in employment: an employee, self-employed, on a WBL programme or an unpaid family worker. This includes young people in full-time education who also have part-time jobs. ILO unemployed: anyone (including full-time learners) who is out of work, available to start work in the next two weeks, and has either looked for work in the last four weeks or is waiting to start a job they have already obtained. economically inactive: neither in employment nor ILO unemployed i.e. not active in the labour market. This includes those not looking for work because they are students and those who are looking after dependants at home. |
| Not in education, employment or training (NEET) | Anybody who is not in any of the forms of education or training and who is not in employment is considered to be NEET. As a result, a person identified as NEET will always be either unemployed or economically inactive. NEET is estimated in the publication:
|
| Other Education and Training (OET) | Refers to young people who are studying, but are not included in other categories. The majority of these young people will be studying part-time in a further education college or sixth-form college or other institution types described under the heading ‘part-time education’. Wholly privately funded training not picked up in the administrative data collections is also included under other education and training (OET) which is estimated using the labour force survey. The relative contribution of private training and part-time education to OET can be estimated using the ‘create tables’ option on EES. |
| Provisional data | The figures for the latest year are provisional and will be updated in the next annual release. All other figures are final but are subject to change if revised population estimates become available. |
| Qualification levels | If a young person is studying qualifications at different levels they are reported against their highest level of study. All qualifications studied are classified as one of the following seven main categories:
Qualification levels are defined by the Qualification and Credit Framework (QCF). For further information and examples see Compare different qualifications. Young people in full-time education studying more than one course are attributed to the course appearing first in the list. The June 2017 release included for the first time further detail for those taking technical or vocational level 2/level 3 qualifications. Following the review of vocational education by Professor Alison Wolf, one outcome was to identify the best level 2 vocational qualifications as ‘tech certs’ and the best level 3 vocational qualifications as either ‘tech level’ or ‘applied general’, and ask employers and universities to endorse them, so young people know what courses have the best job prospects. Courses were taught from September 2015 (most tech certs from September 2016) and each year a list of qualifications approved by DfE for teaching to 16 to 19 year olds and reported in the technical and vocational categories of the 16-19 performance tables is published (see GOV.UK for further information). In order to determine whether the level 2/level 3 qualification a young person is participating in is classified as a tech cert/tech level/app gen in this publication, the ‘planned’ or (if populated) the ‘actual’ course end date is used to determine in which performance table year the outcome would be reported. The approved qualification list for that year is referenced to make the classification. The June 2021 release includes young people taking T levels. T Levels are new courses which follow GCSEs and are equivalent to 3 A levels, hence are level 3 qualifications. These 2-year courses, which launched September 2020, have been developed in collaboration with employers and businesses so that the content meets the needs of industry and prepares students for work, further training or study (see Introduction of T Levels - GOV.UK (www.gov.uk) for further information). |
| Apprenticeships/ Work-based learning (WBL) | From 2013 work based learning has been comprised solely of apprenticeships. Prior to 2013 the work based learning category included other work related provision including basic skills and individually tailored provision and learning as part of Train to Gain (NVQ only prior to 2008). Pre 2010, work based learning included the Entry to Employment learning programme. |
Overview of methodology
The estimates of participation in education, training and employment combine data from a number of sources:
The population at each age is based on Office for National Statistics (ONS) estimates, adjusted so that they relate to academic age and the end of the calendar year.
Participation data from administrative sources is then subtracted from this total. Participation estimates are made by combining administrative data from schools, further education, work-based learning (apprenticeships) and higher education. Procedures are included to identify young people in more than one form of provision, to give a view of the cohort as a whole.
The labour market status (whether a young person is employed, ILO unemployed or economically inactive) is then estimated from the labour force survey (LFS) for each of the major groups:
- Full time education (FTE)
- Work based learning (WBL), comprises solely of apprenticeships from 2013
- Employer funded training (EFT)
- Other education or training (OET)
- Not in education or training (NET)
Those in the NET group whose labour market status is economically inactive or ILO unemployed are concluded to be NEET.
Participation methodology (detailed)
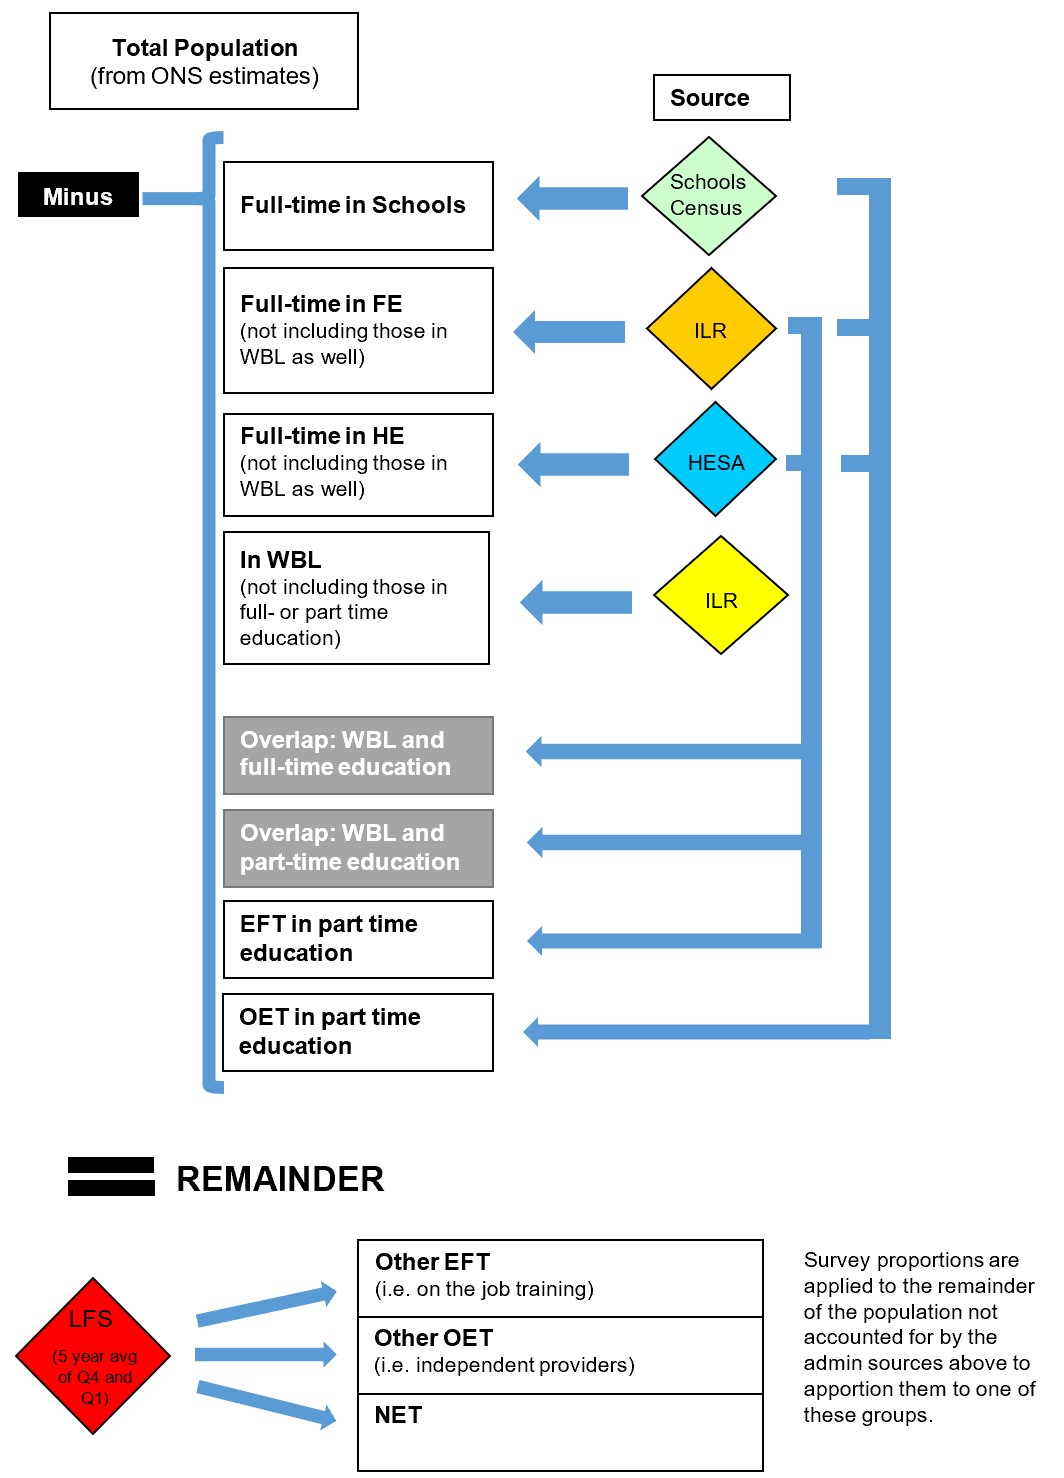
Explanation of Figure 1.
- The total population of 16-18 year olds in England is taken from ONS estimates and projections.
- From the information provided in the administrative data sources, the total number of students in full- or part-time education and in WBL is then subtracted from the population total.
- Historically there have been very small overlaps of students studying in FE/HE and WBL at the same time. Historic proportions from the ILR and HESA data are used to estimate the size of these overlaps.
- Part time education is split by whether or not it is funded by an employer – this is captured on the ILR and HESA data (it is assumed that the very small number of individuals studying part time in schools are not funded by employers). If it is funded by employers it is ‘Employer Funded Training (EFT)’, otherwise it is ‘Other Education and Training (OET)’.
- The remainder from the calculations above is apportioned between three groups for which there is no administrative data, using a 5 year weighted average of Q4 (Oct-Dec) and Q1 (Jan-Mar) of the LFS proportions.
The three groups are:
- non-college based EFT (and not part time education that would be captured by the admin sources) i.e. on the job training (‘Other EFT’ in figure 1);
- non-college based OET (and not part time education that would be captured by the admin sources) i.e. independent training providers (‘Other OET’ in figure 1) and;
- Not in Education or Training (NET)
- Overlaps are accounted for:
- Learners studying an FE course as well as participating in WBL (in the same FEI) are included in the full-time figure as well as the WBL figure, but also reported in the overlap group and counted once in the totals.
- Learners participating only in WBL in an FEI are reported as WBL only.
- Learners in Employer Funded training (EFT) as well as publicly funded full-time education are only included in the full-time figure and not the EFT figure.
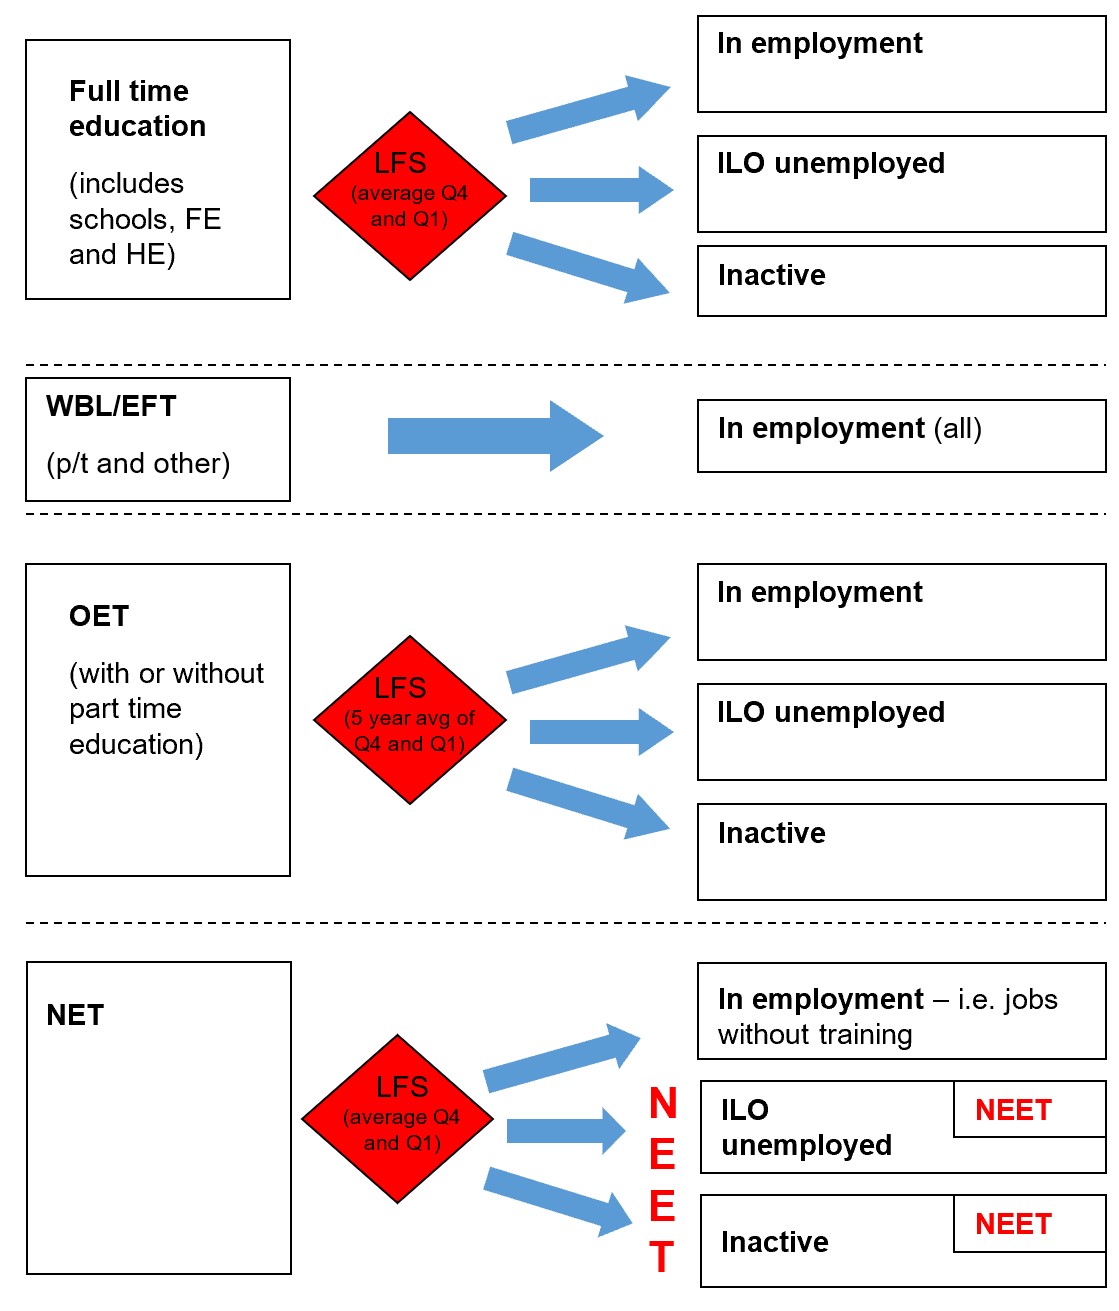
Explanation of Figure 2.
The labour market status is then estimated for each of the major groups identified above (full time education, WBL, EFT, OET, NET):
- Those in full time education are apportioned to (a) employment; (b) ILO unemployed or; (c) inactive, using an average of Q4 (Oct-Dec) and Q1 (Jan-Mar) estimates from the LFS.
- All those in WBL or EFT are assumed to be in employment.
- Those in OET are apportioned to (a) employment; (b) ILO unemployed or; (c) inactive, using a five year weighted average from the LFS, because the LFS sample size for this group is so small.
- Those who are NET are apportioned to (a) employment; (b) ILO unemployed or; (c) inactive, using an average of Q4 and Q1 estimates from the LFS. Those in (b) and (c) are NEET.
NB. A person is defined as in employment if they are an employee, self-employed, on a WBL programme or an unpaid family worker. This is the ILO (International Labour Organisation) definition and includes young people in full-time education who also have part-time jobs.
(Proportions estimated from the LFS applied to Annex A totals)
Revisions to previously published estimates
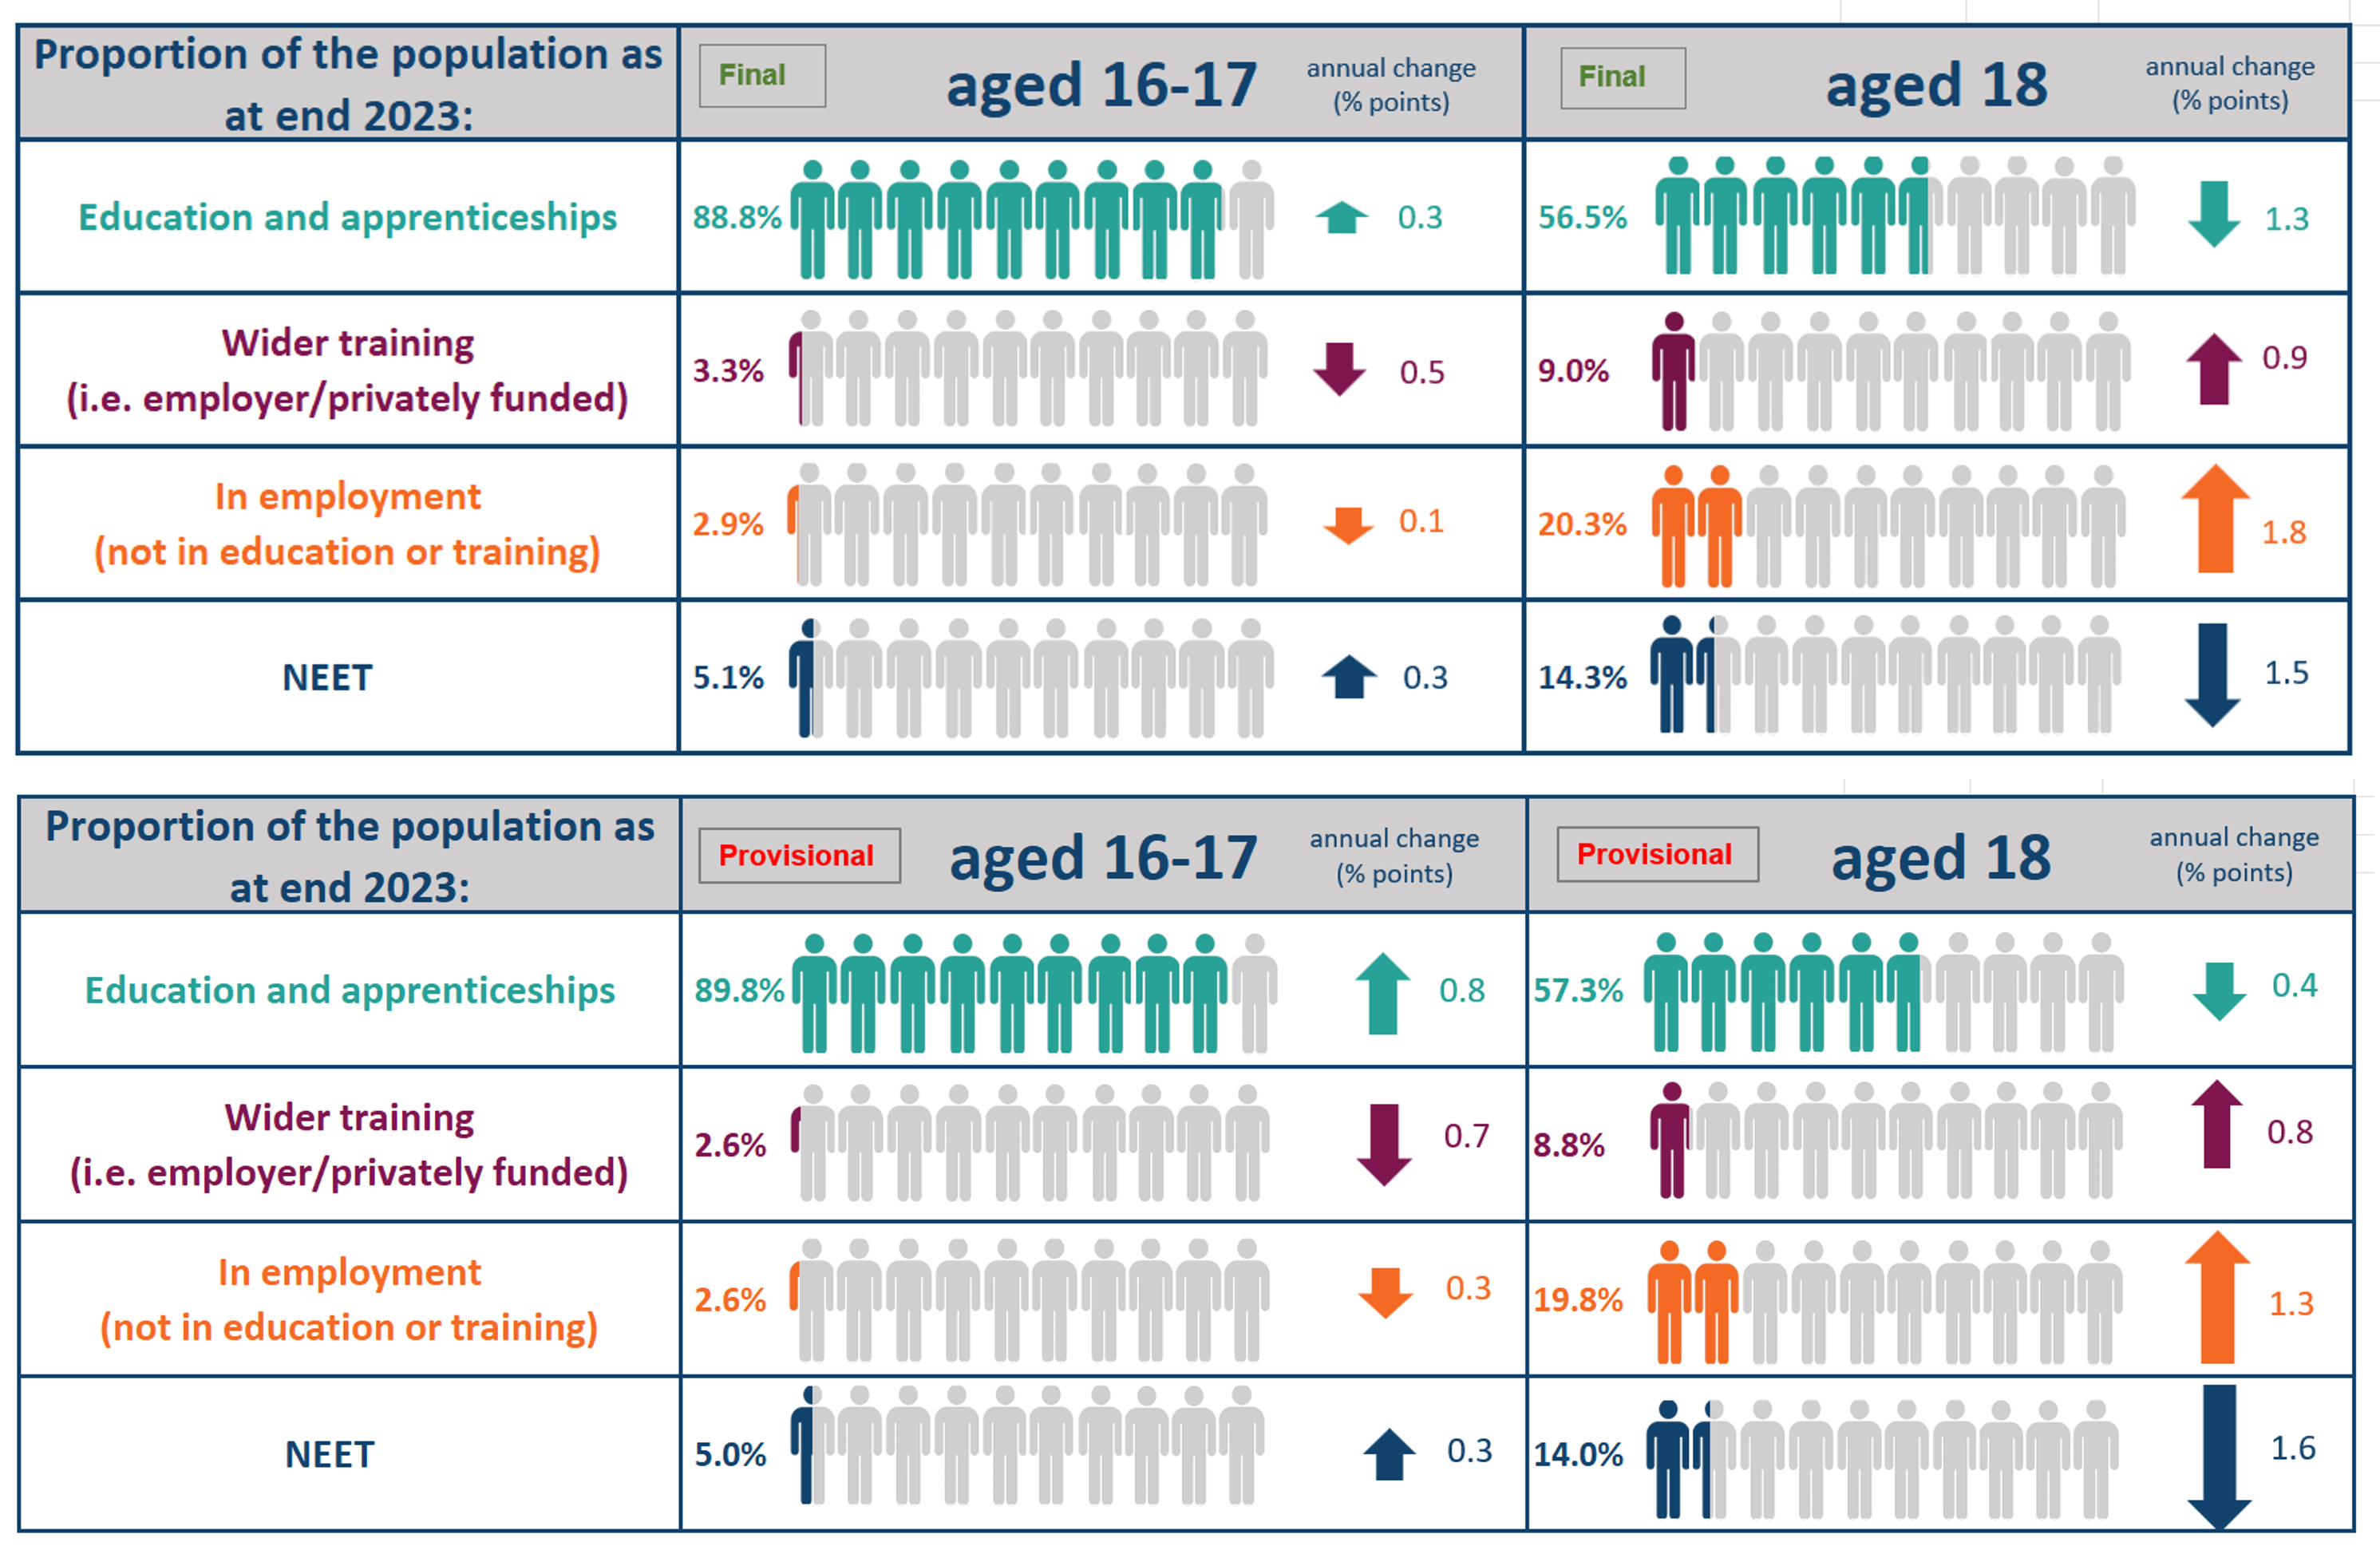
Changes from provisional end 2023 to final end 2023 headline measures as a result of revisions to administrative data, ONS population estimates, LFS reweighting and methodology change as outlined in this section
The table shows the headline measures for the 16-18 population at the end of 2023 as published in the statistics publication ‘Participation in education, training and employment: 2023’ (in September 2024) compared with revised estimates for the same period as published in ‘Participation in education, training and employment: 2024’ (in June 2025).
As the sections above explain these changes result from
- Population revisions following ONS publications.
- Labour Force Survey (LFS) reweighting and a change to the way missing responses are apportioned.
Revisions to administrative data: ILR SN14 v SN06 and more robust estimates of HE participation using HESA rather than estimates from HESES.
Revisions to population estimates
The Department for Education (DfE) uses the Office for National Statistics (ONS) population estimates to produce pupil projections annually. DfE Pupil Projections are normally published as Official Statistics in July. Their primary purpose is as input data for a number of the departments’ statistics, including the Participation in education, training and employment 16–18 statistics.
ONS’s census was held in 2021 and the results used in the creation of their mid-2021 population estimates. Prior to this the 2011 census was used as the basis for their population estimates for 2011 onwards. ONS published analysis (opens in new tab) showed some large differences in the 2021 census-based estimates and estimates rolled forward using the normal methodology (previous year’s estimates with adjustments for births, deaths and migration). The differences showed, for example, a drop of over 5% in the estimated populations aged 6 and 7 in 2021. It can now be seen that their annual population estimates since 2011 (the last set based directly on a census) have been gradually moving away from what is now known (via the 2021 census) to be the actual population.
2025 Publication
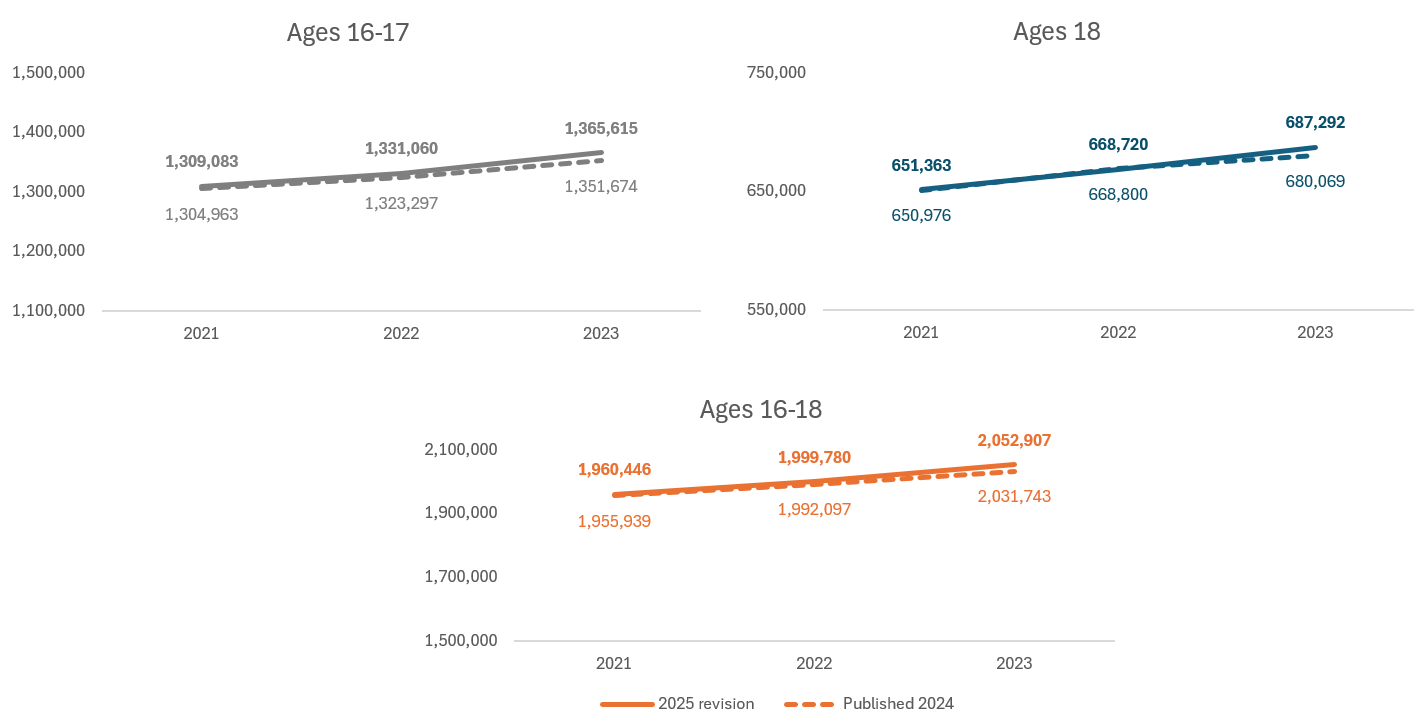
The latest population estimates used in the Participation in education, training and employment 16–18 statistics use ONS rebased mid-year estimates for 2023. For 2024 projections (published Jan 25) have been used which have taken account of migration up to June 2024 (published Nov 24). Further migration stats have since been made available covering the period to December 2024 but these have not been used in this release and may lead to some revisions in the future.
Estimates for 2011 to 2020 (following the 2021 census) have been used and original estimates for mid-2021 and mid-2022, adjusted to academic age and end of the calendar year.
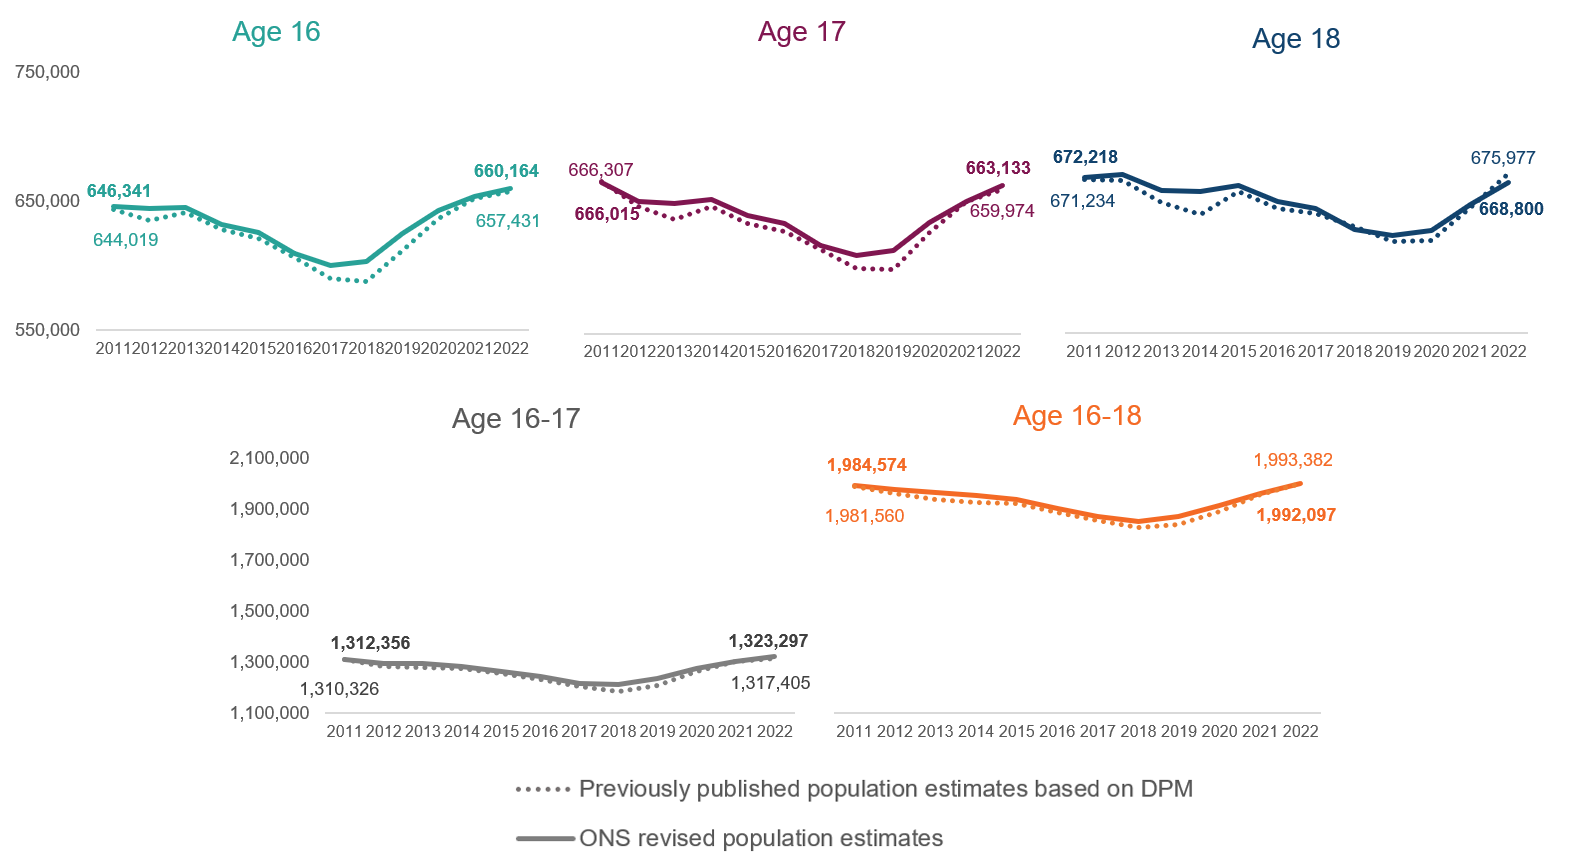
Charts showing the revised population estimates from 2021 by age compared with those previously published
2024 Publication
The population estimates used in the Participation in education, training and employment 16–18 statistics in 2024 were ONS’s rebased mid-year estimates for 2011 to 2020 (following the 2021 census), original estimates for mid-2021 and mid-2022, adjusted to academic age and end of the calendar year.
The re-based population estimates for 2011 to 2022 generally showed an increase in population at all ages 16, 17 and 18 but follow a very similar trend to previously published.
Charts showing the revised population estimates by age compared with those previously published (based on the experimental dynamic population model (opens in new tab) (DPM))
Impact of population revisions on the participation in education, employment and training release (2024 release)
All numbers published in the 16-18 Participation in education, employment and training release are expressed as a proportion of the population cohort therefore revising the population estimates back to 2011 will impact on proportions in education, employment and training for the period.
If the population estimate is revised upwards then all things being equal (that is no change in the administrative-based estimate of learner numbers) the statistics for the proportion of the population studying will be revised downwards proportionately. In addition, there will be a more direct impact on the estimate of the numbers of young people not in education and training.
This is calculated, for the most part, as a residual from the size of the population and the number of young people recorded as participating on administrative datasets, so an increase in the population will result in an increase in the estimate of young people not in education or training (NET) and correspondingly in the estimate of young people not in education, employment or training (NEET) also.
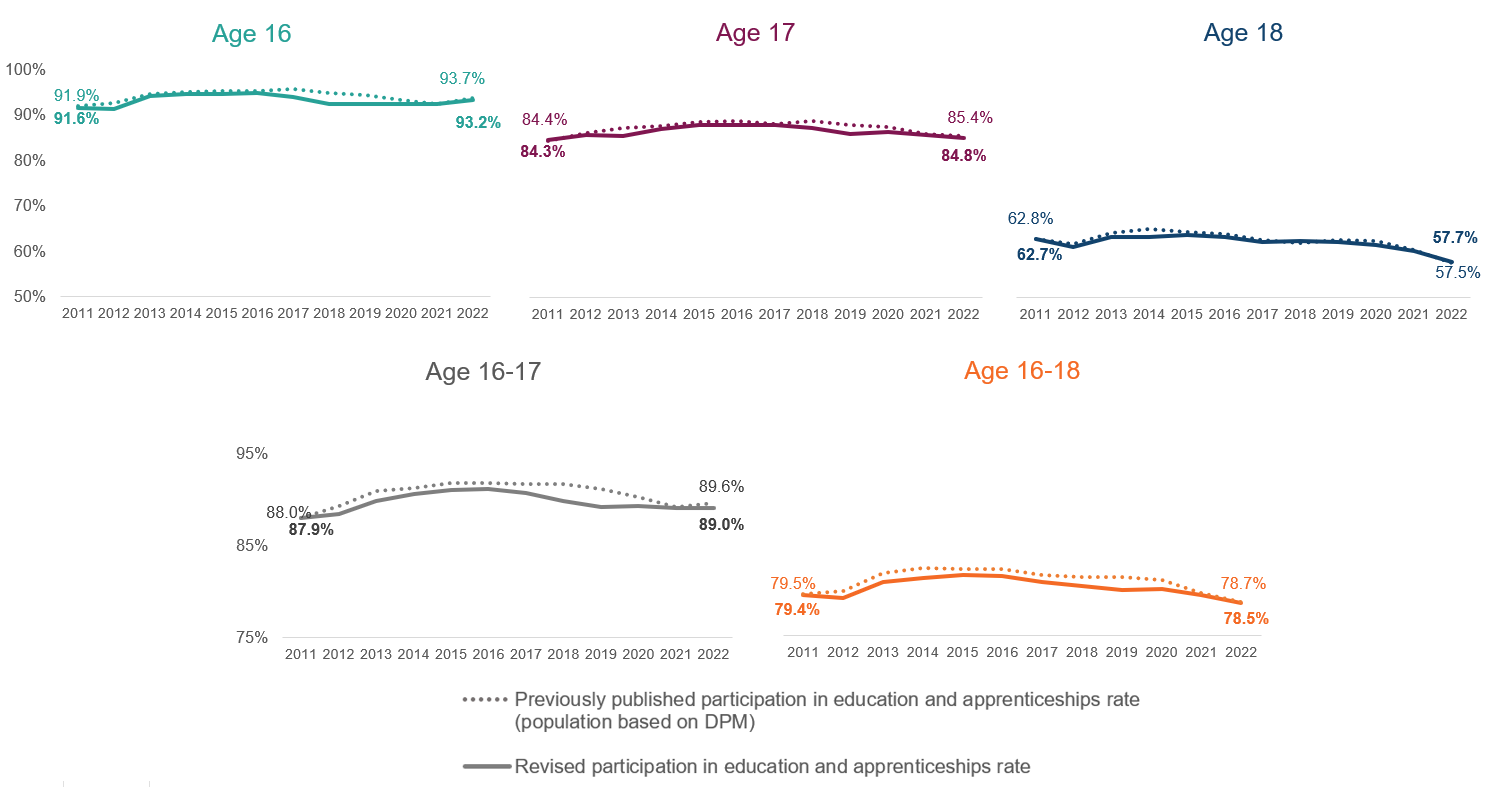
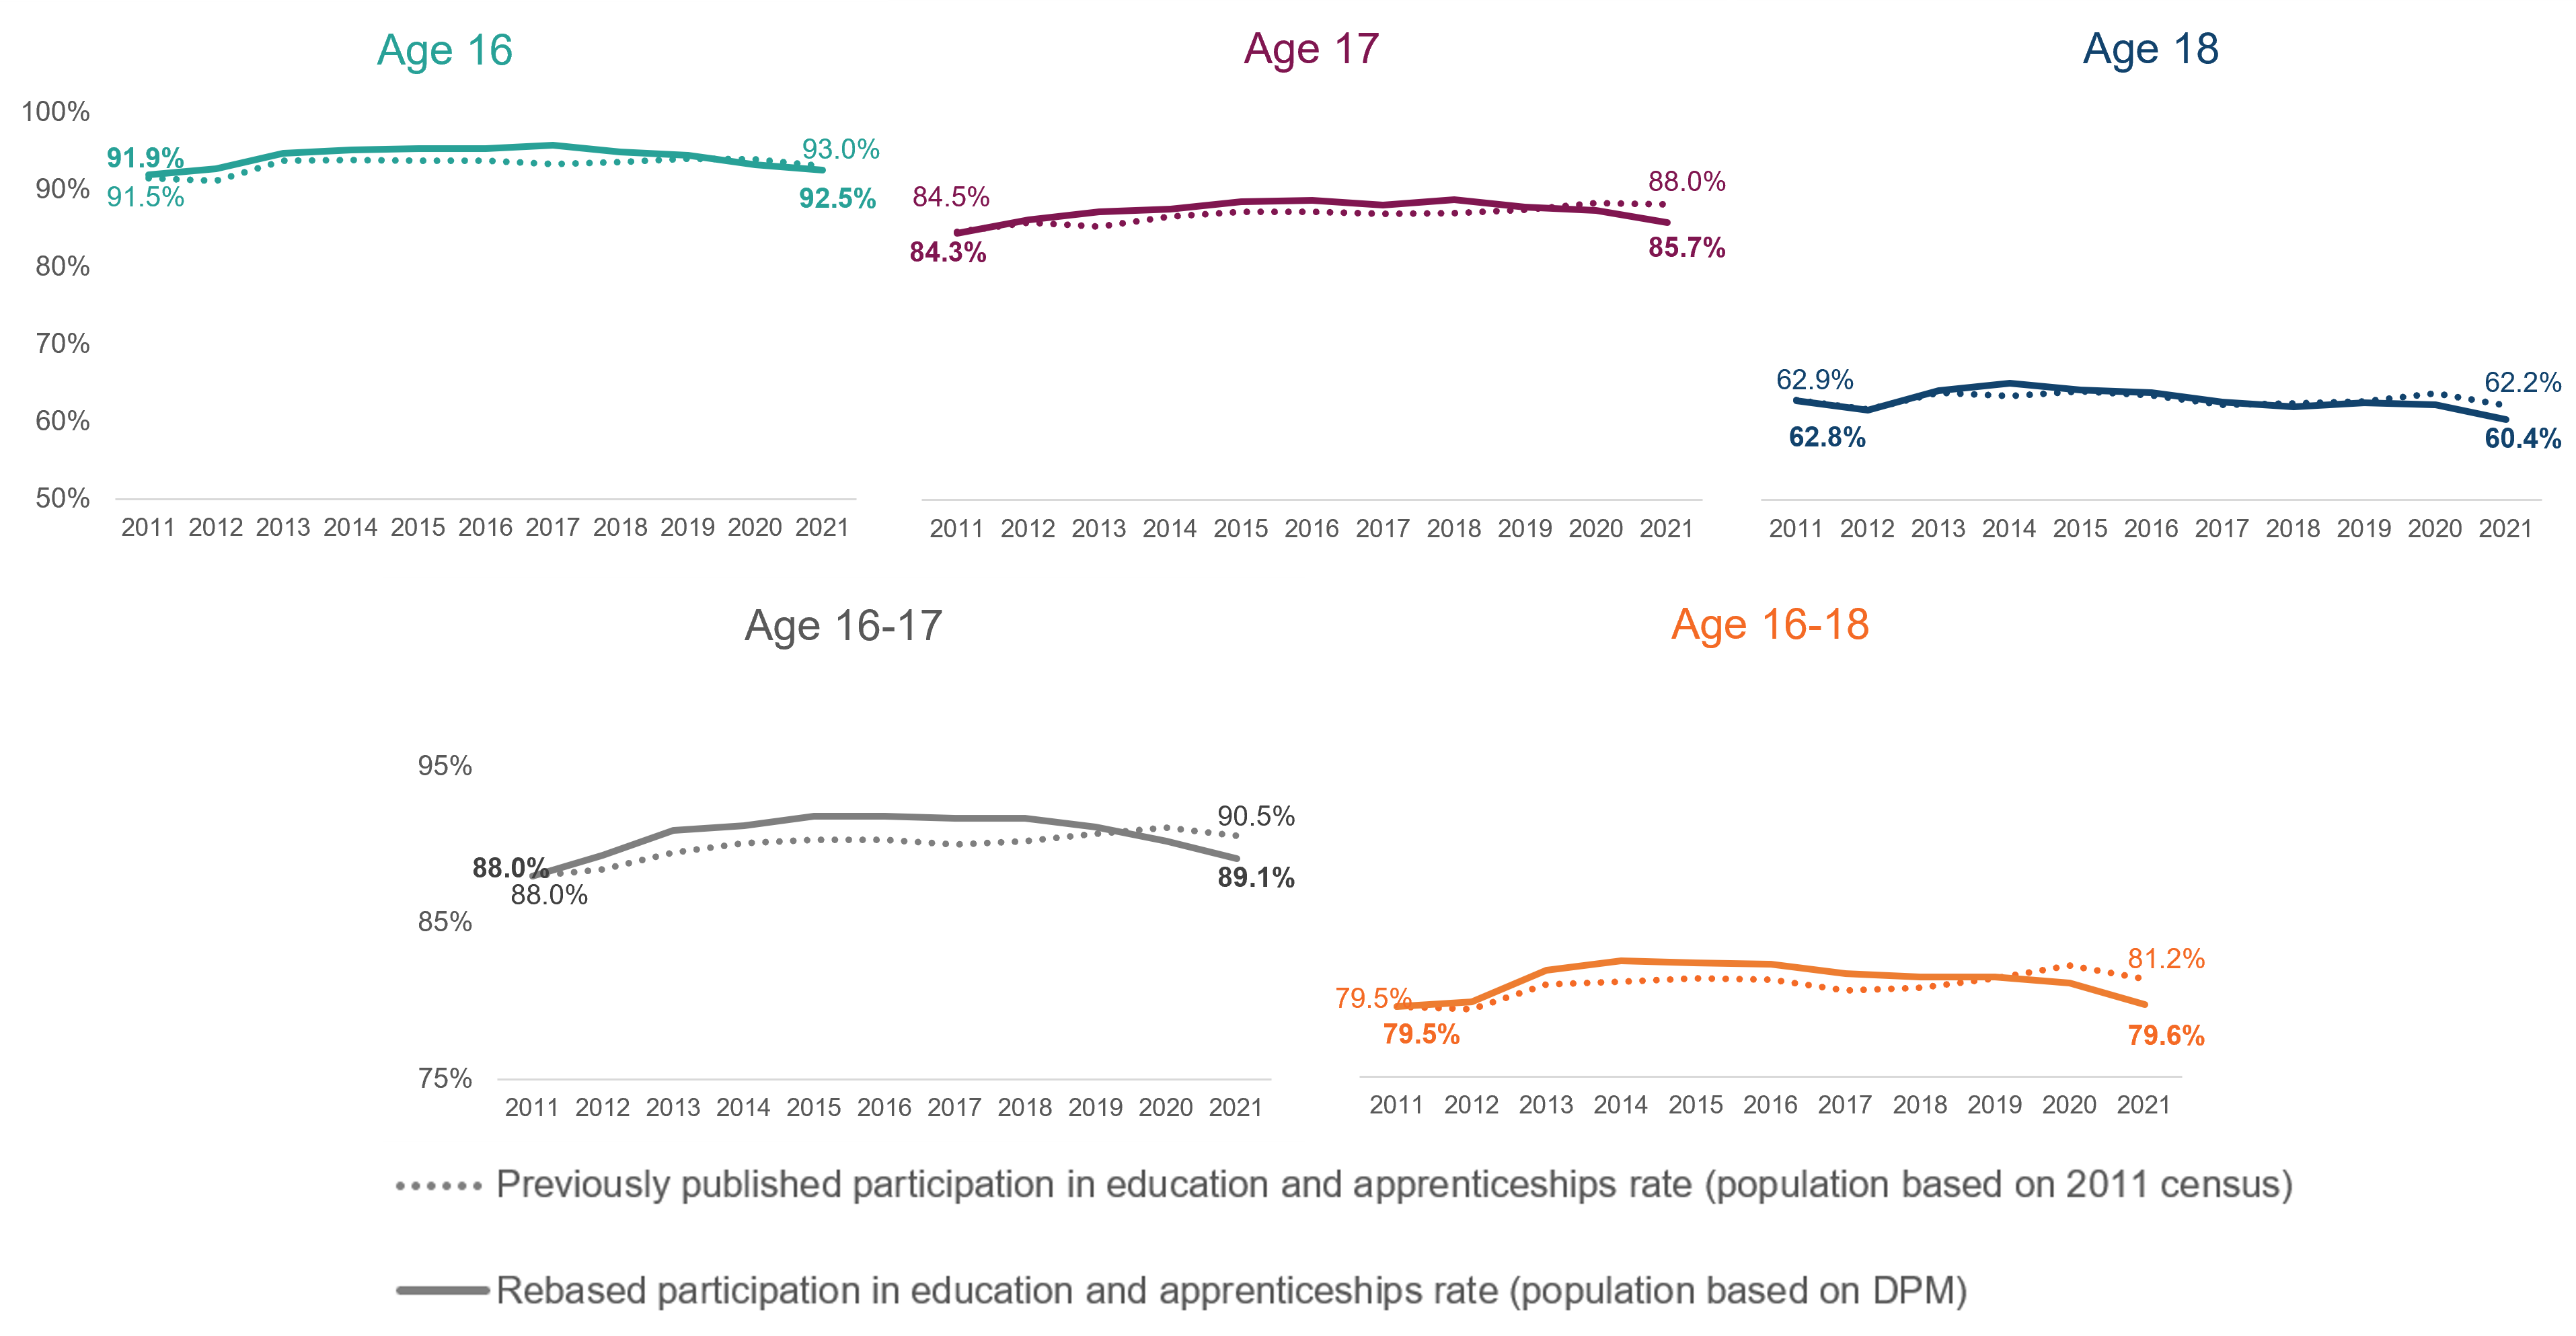
Revisions to participation in education and apprenticeship rates (2024 release)
Proportions in education and apprenticeships follow a very similar trend to previously published but with slightly lower participation rates.
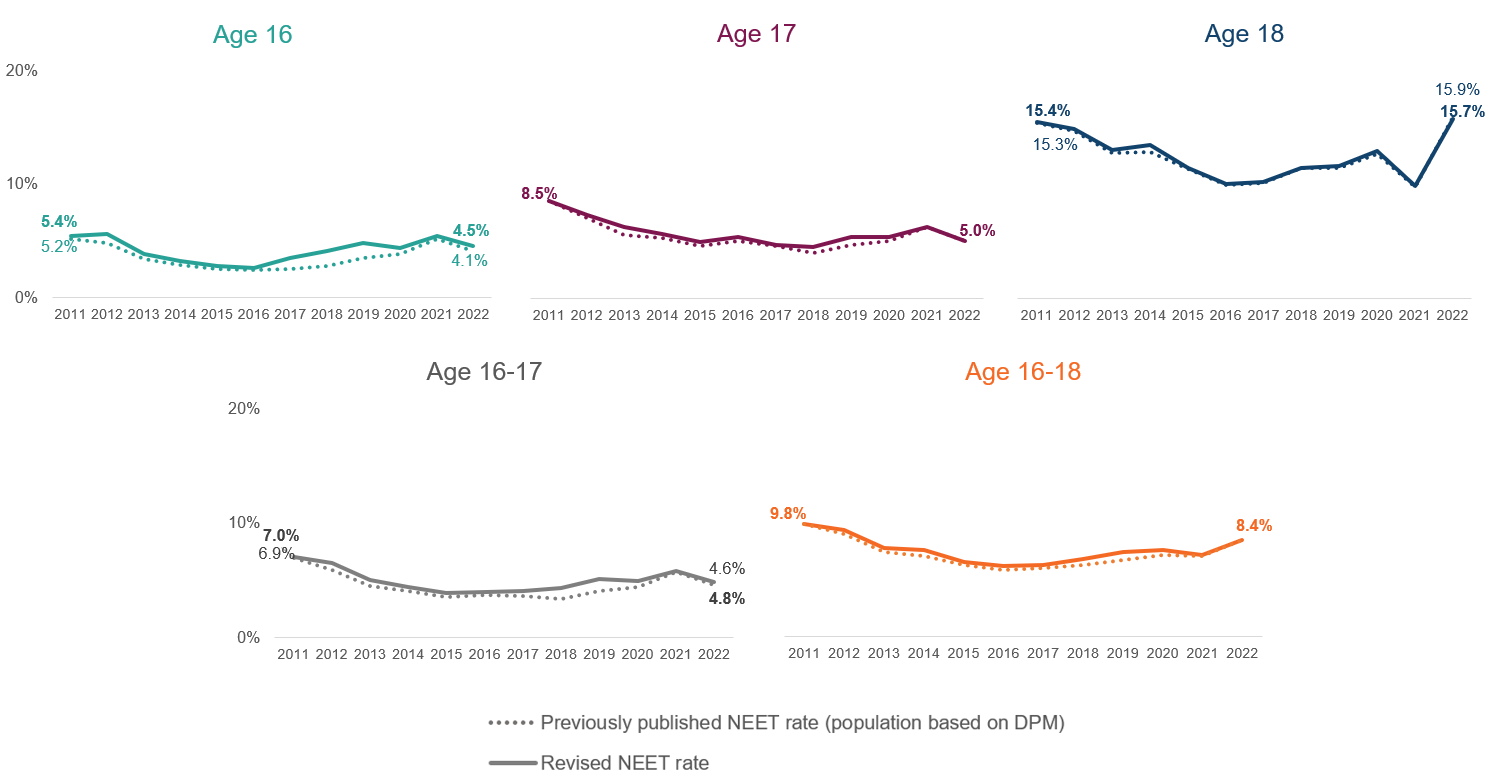
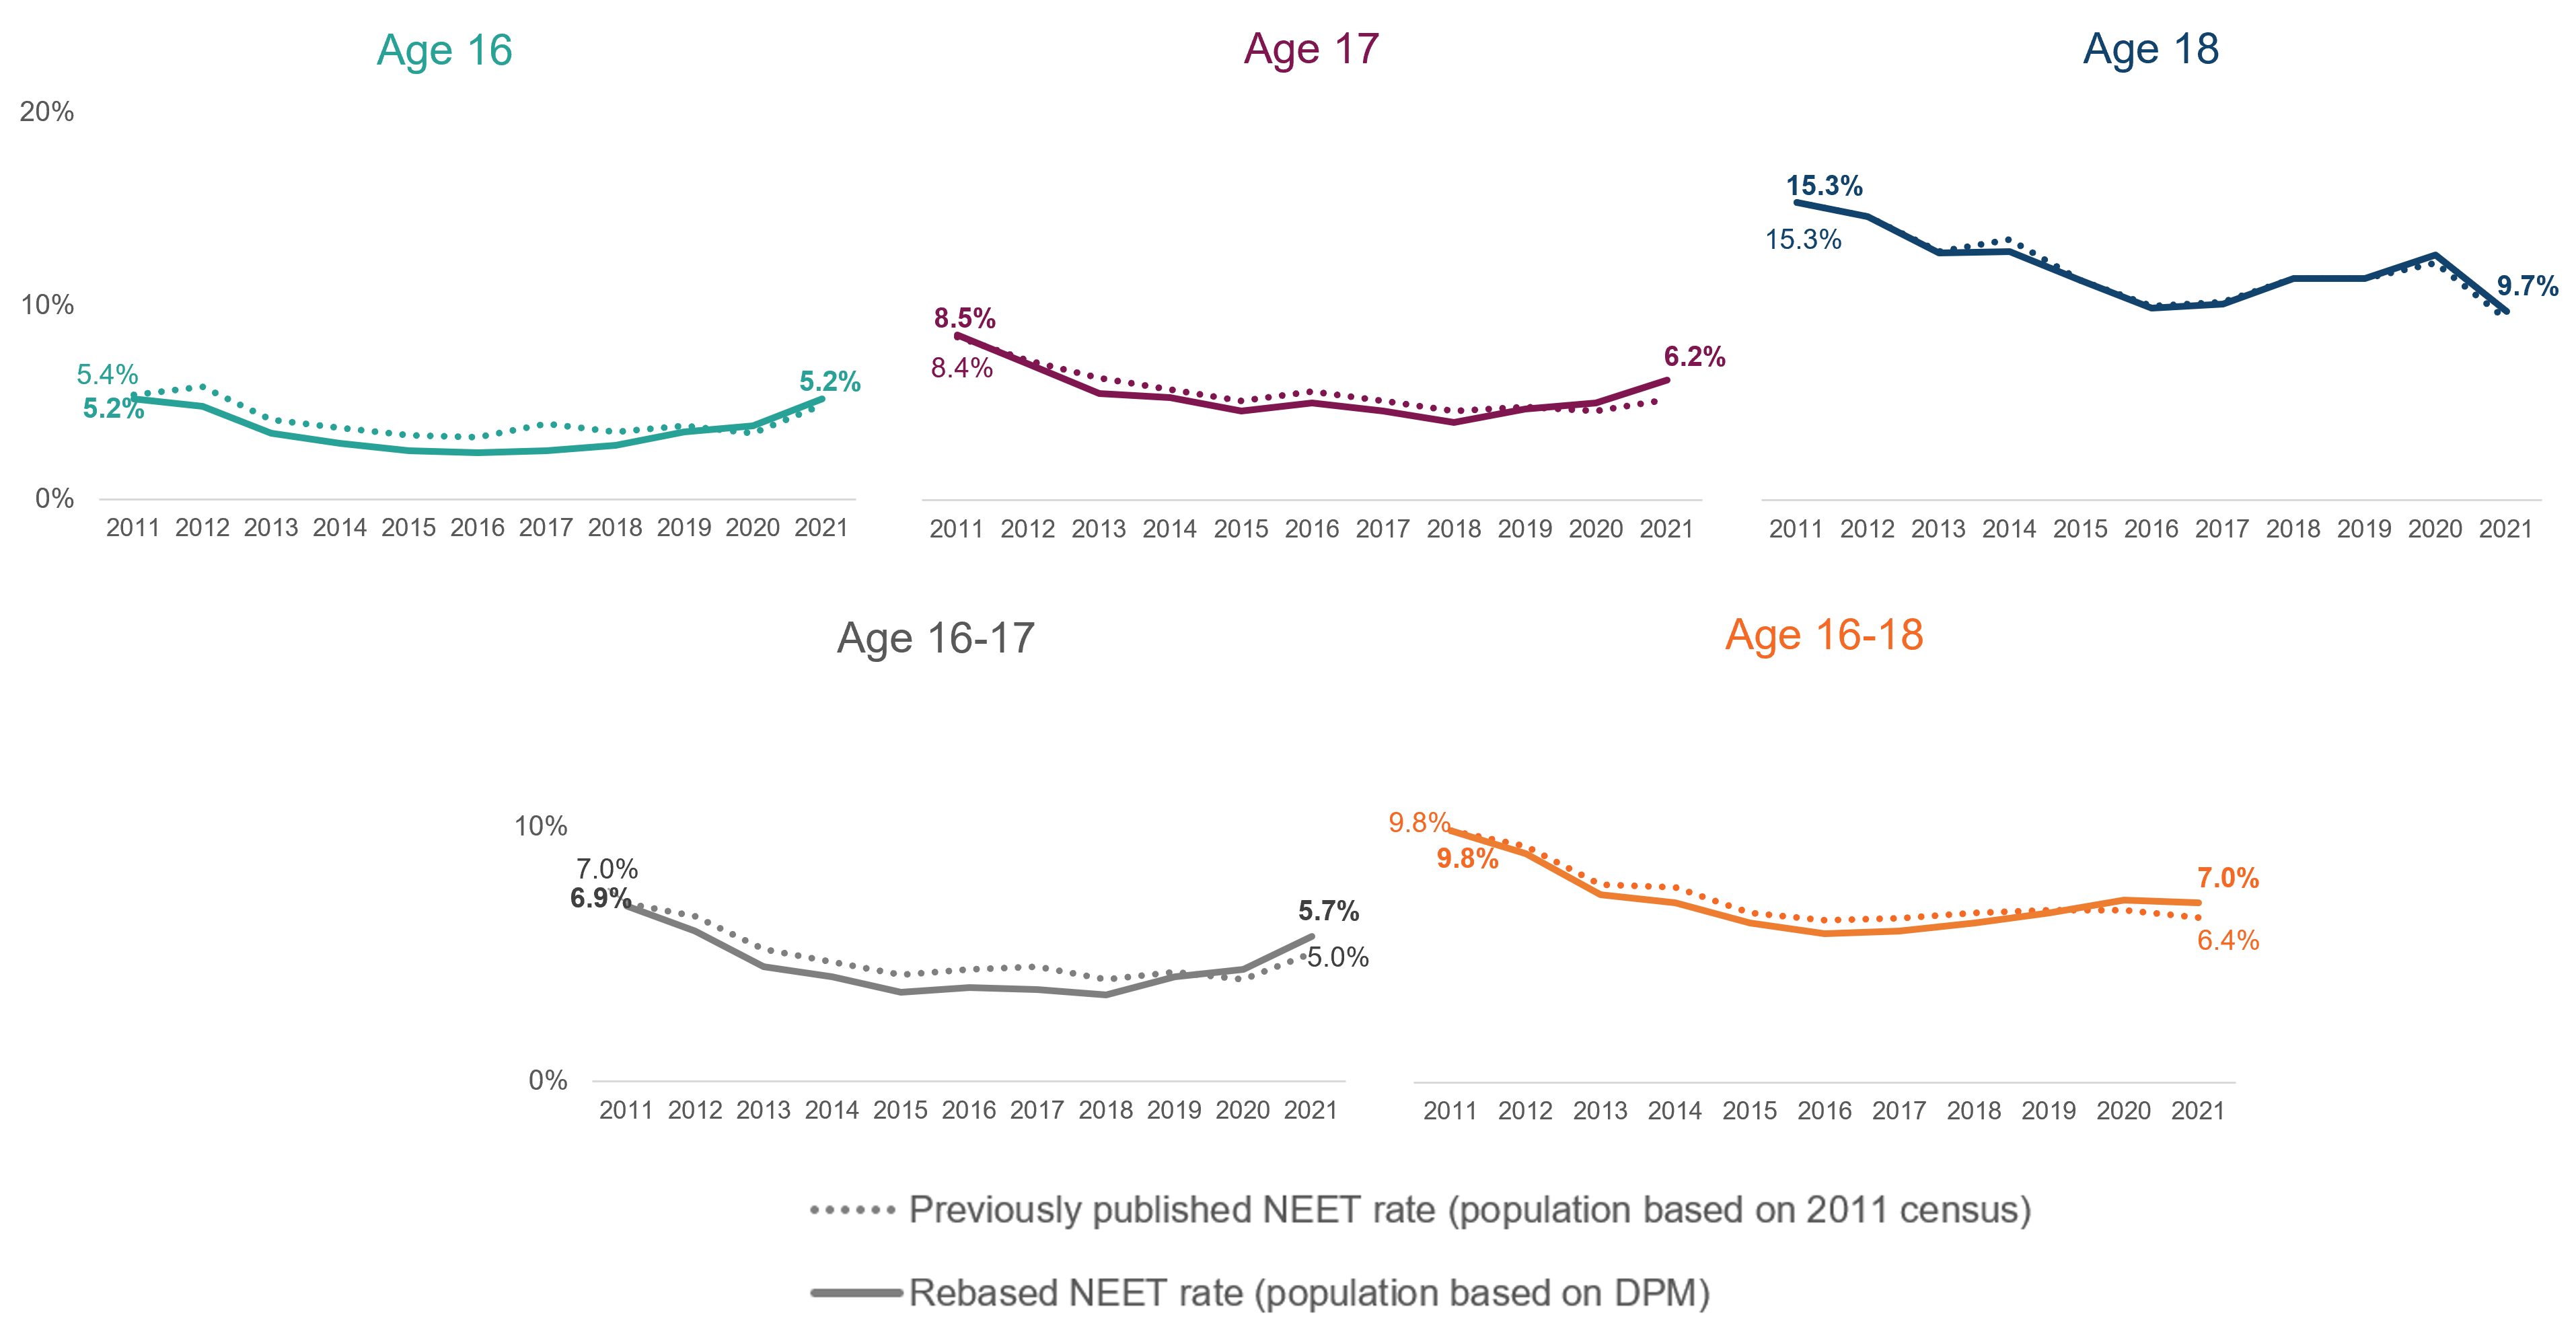
Revisions to Not in education, employment or training (NEET) rates (2024 release)
Similarly, the proportions NEET follow a very similar trend to previously published at all ages but with slightly higher NEET rates.
2023 Publication
In 2023, delays to ONS mid-year population projections (2022) and rebased estimates 2011-2021 affected the provision of ONS population datasets required for pupil projections. ONS announced a delay to their population estimates (opens in new tab) due to the challenge of incorporating the 10 year census data and methodology issues on migration data. The delay meant that DfE were not able to produce 2023 pupil projections using the usual data sources to necessary timescales.
In order to deliver rebased 2023 pupil projections DfE used the experimental dynamic population model (opens in new tab) (DPM) for population estimates between 2011 and 2021.
A full explanation of the methodology can be found in the DfE National Pupil Projections publication.
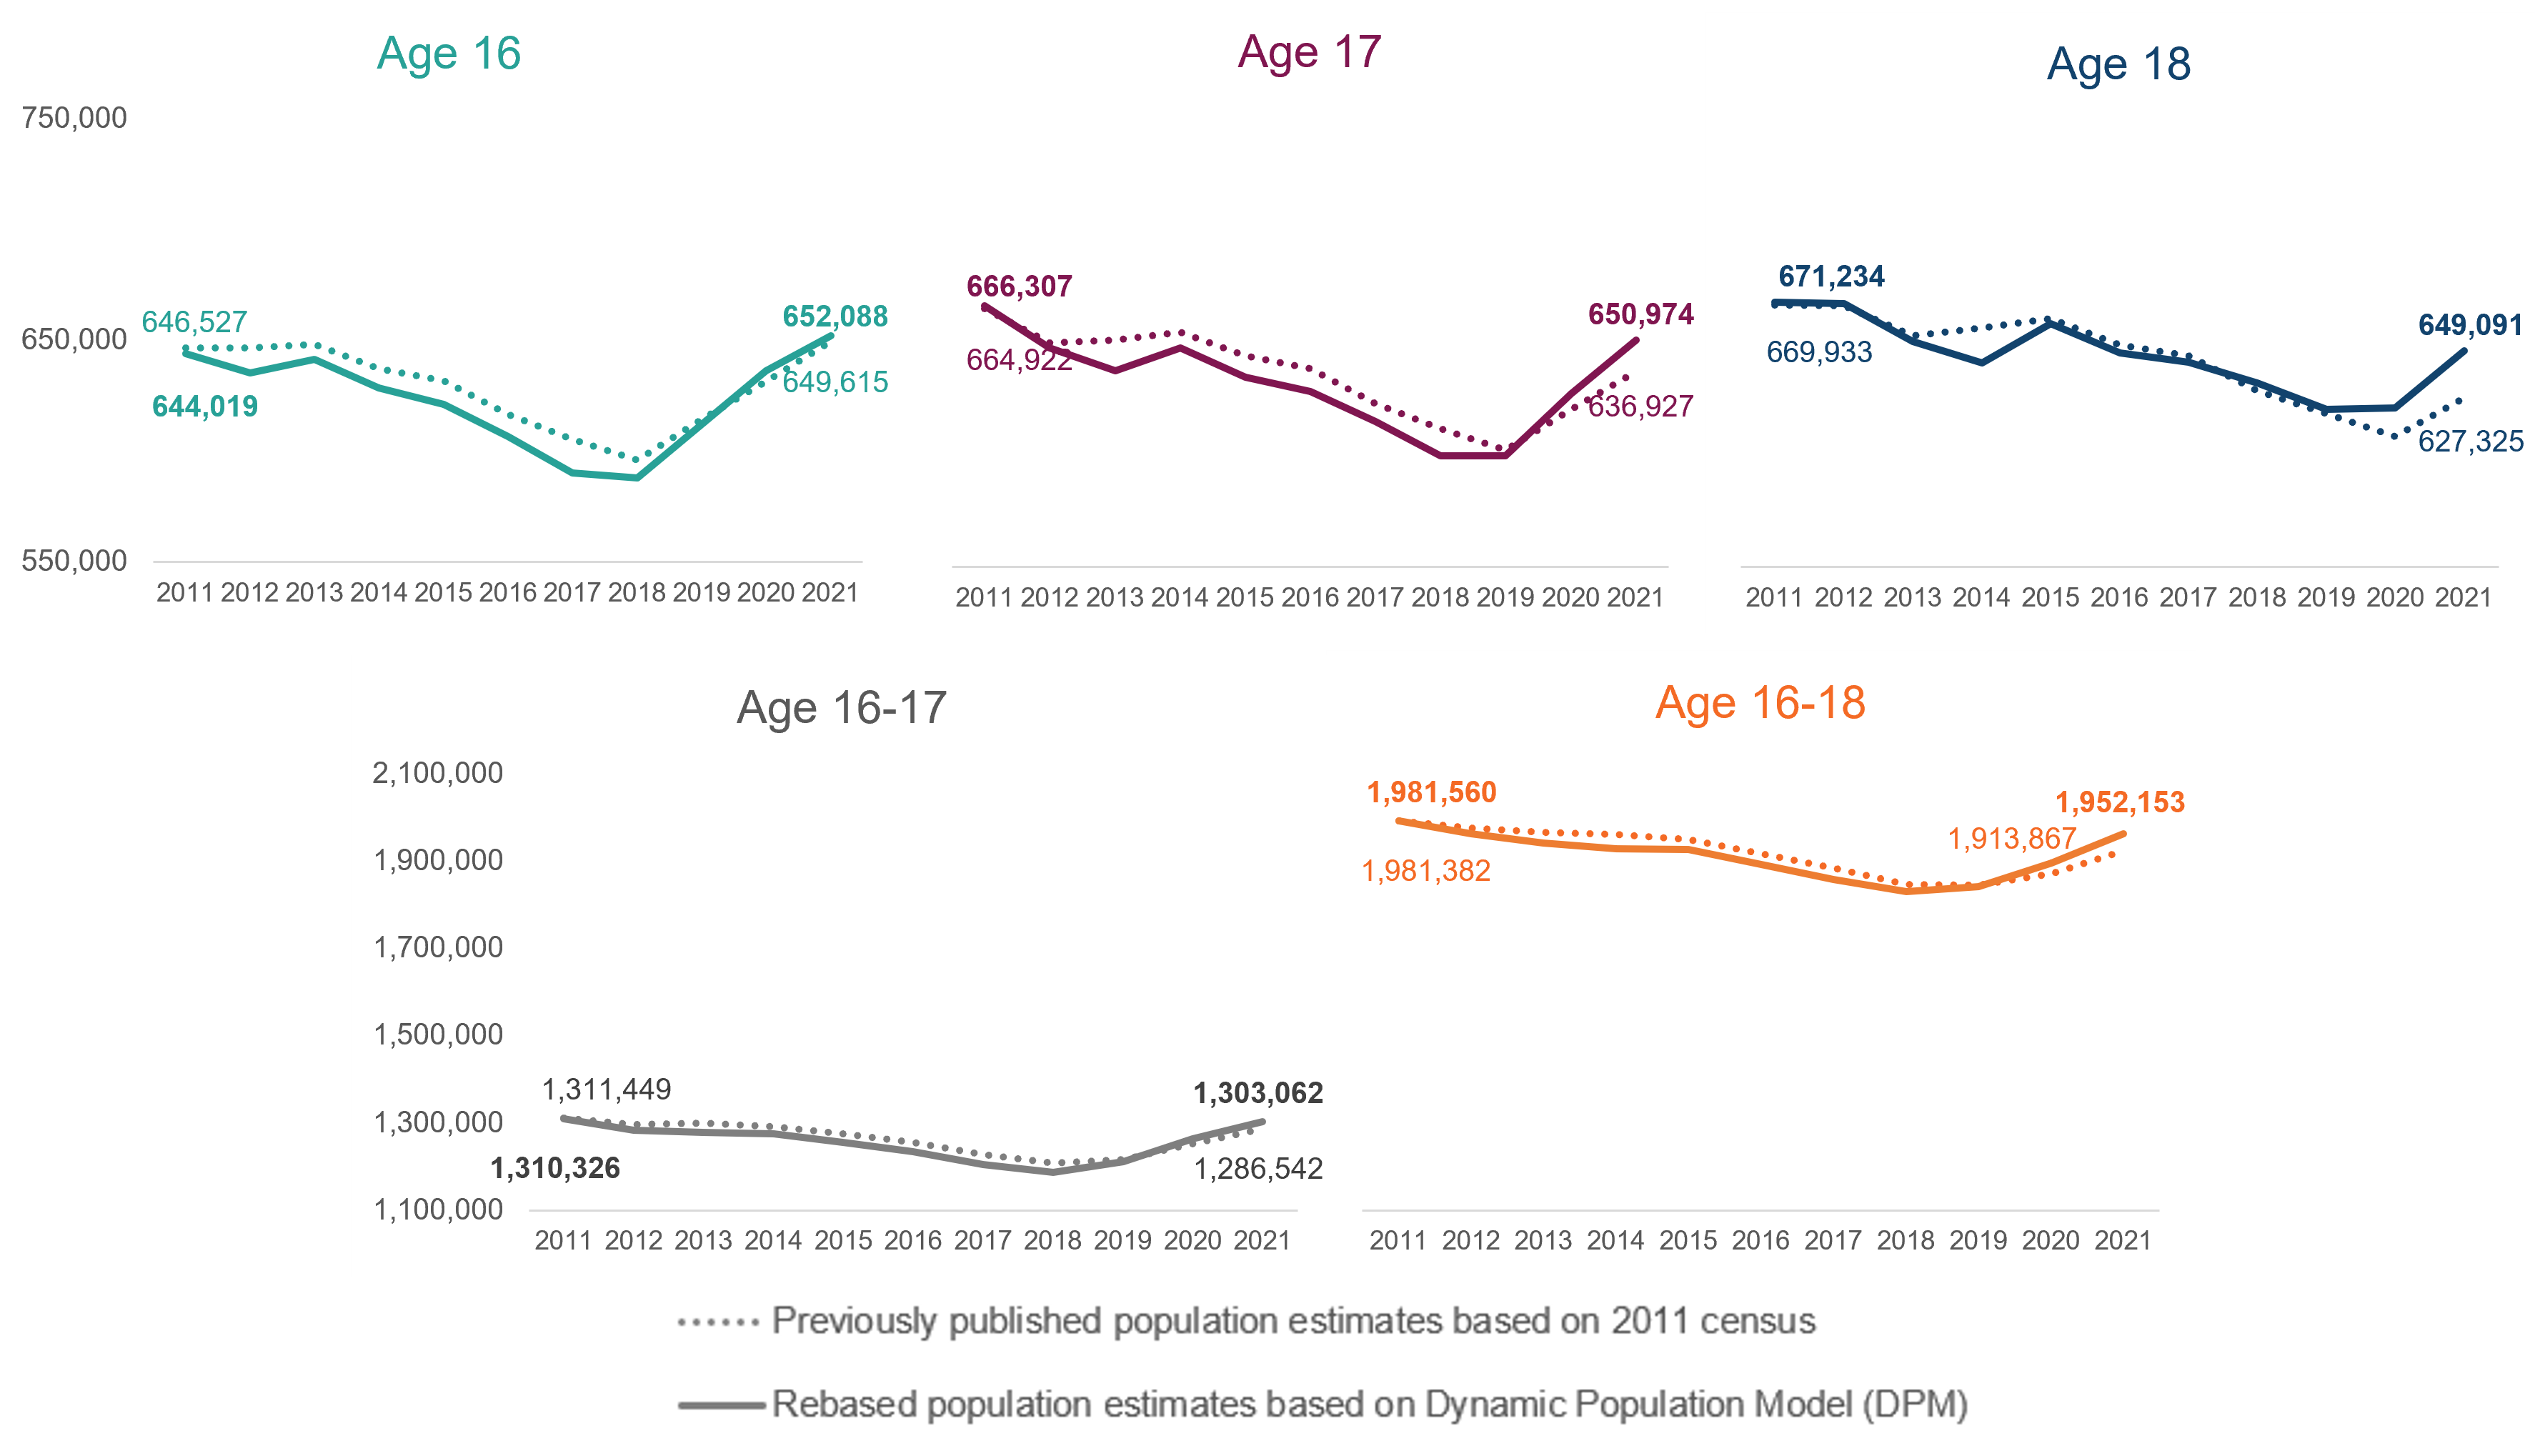
Charts showing the population estimates as published in 2023 by age compared with those previously published in 2022
Impact of population revisions on the participation in education, employment and training release in 2023
Participation in education and apprenticeships (2023 release)
Proportions in education and apprenticeships followed a very similar trend to previously published but with slightly higher participation rates between 2011-2019 and then slightly lower in 2020 and 2021.
Not in education, employment or training (NEET) (2023 release)
Similarly, the proportions NEET followed a very similar trend to previously published at all ages but with slightly lower NEET rates between 2011-2019 and then slightly higher in 2020 and 2021.
2022 Publication and prior
Prior to the 2021 census, ONS's population statistics were re-based every two years. Population estimates were revised in accordance with the availability of re-based data and consistent with those used in the DfE National Pupil Projections publication .
Revisions to administrative data
Revisions to Further Education (FE) and apprenticeships data
Data from the FE sector and data related to apprenticeships (previously WBL) is recorded on the Education Skills Funding Agency (ESFA) Individual Learner Record (ILR). For provisional data in this statistics publication we use SN06 and for final data the audited SN14 return.
Therefore, the numbers participating in further education institutions (FE colleges and sixth-form colleges), and apprenticeships/WBL are revised as the source data are finalised. These planned revisions only occur for the latest year for which statistics are published. Such changes can affect both the numbers studying and the proportion of the age cohort studying.
The FE sector includes a small number (approx. 5%) of young people in provision delivered by private, commercial, charitable and local authority providers.
Revisions to HE data
Estimates of the number of young people in higher education are provided by the Higher Education Statistics Authority (HESA). The HESA data gives a qualification breakdown for students in English HEIs by academic age, gender, full-time/part-time and by whether they are on any employer funded training (EFT).
The official Higher Education Statistics Agency (HESA) estimates of numbers in higher education institutions are published annually in January. Provisional data uses the previous year’s HESA data and adjusts according to latest year estimates from the Higher Education Students Early Statistics Survey (HESES), an annual survey of higher education institutions about students on recognised higher education courses. As HESES data is for all students, not just 16-18, and is for under graduate new entrants, it is not definitive, but does give an indication of the trend in HE numbers.
At ages 16 and 17 there are very small numbers in Higher Education Institutions and so any revisions of this source have very little impact. At age 18 however, where around 30% of the population are in HE institutions, any changes in estimates between provisional and final data can have a large impact on headline proportions participating.
Revisions to schools data
There are no changes to overall school numbers from the school census between provisional and final data. The pupil level annual school census (PLASC) from the spring term is used for overall state-funded school numbers and the school level annual school census (SLASC) for independent schools and general hospital school numbers.
From 2017, largely due to a number of sixth-form colleges converting to academies but continuing to return the ILR as oppose to the school census, schools data from PLASC and SLASC has been appended with data from the ILR. There can be some revisions to the ILR as provisional data uses SN06 and final data SN14.
Prior to end 2021 data, revisions to qualifications by mode of study (full/part-time) and school type were made using PLAMS (post 16 learning aims data). The PLAMS data is autumn census data matched to attainment data and is therefore a more robust estimate of highest qualification aims in schools. This PLAMS output was then re-apportioned using the school census population numbers as in provisional estimates so totals remained unchanged. This update using PLAMS made very minimal changes to the allocation of highest qualification aim overall, with less than 0.2% of young peoples qualifications being revised. The decision has been made to no longer revise these estimates.
Revisions to Labour Force Survey data
Reweighting
Labour Force Survey (LFS) datasets are routinely reweighted in line with population estimates. ONS announced in March 2017 that the reweighting of the LFS would take place every year.
In December 2024, the LFS was reweighted from quarter 1 2019 to use more recent population estimates (2022 mid-year) adding a new weighting variable PWT24 . This latest reweighting exercise creates a discontinuity between estimates prior to and after 2019. However, the re-weighting exercise has had minimal impact on NEET rates and they follow a very similar trend to those previously published.
Coronavirus and measuring the labour market
Because of the coronavirus (COVID-19) pandemic and the suspension of face-to-face interviewing, ONS had to make operational changes to the LFS, which moved to a "by telephone" approach. More information can be found in Coronavirus and its impact on the Labour Force Survey (opens in new tab).
Dealing with missing responses
The Labour Market Status (employed, unemployed, inactive) of the 16-18 population and proportions in wider training (e.g. Employer funded training not captured by DfE administrative data) are estimated from the Labour Force Survey (LFS). An increasing number of missing responses related to education status at age 16 have led DfE to revise the methodology for reapportioning these cases from 2019 which may also lead to a discontinuity.
The revised methodology is now in line with that used by ONS to determine NEET rates and to that used in the DfE 16-24 NEET release based solely on the LFS NEET age 16 to 24, Calendar year 2024 - Explore education statistics - GOV.UK. The article which recommends how missing responses should be apportioned can be found here: ‘Young people who are NEET’ [ARCHIVED CONTENT] Labour Market articles and reports - ONS (opens in new tab).
The impact of the methodology change is mostly on the labour market status of those aged 16. There are also some occasions where there are missing responses at other ages but these are minimal, however the same methodology has been applied.
Looking at the impact at age 16 on the headline measures in 2023:
- No impact on the proportion estimated to be in education or on an apprenticeship (as this is estimated purely from administrative data)
- Slightly more 16 year olds are now estimated to be in ‘other education/training’ (+0.4%).
- Slight increase in the proportion in employment (not in education or training) (+0.1%)
- NEET decreased by 0.5%, a result of the changes above.
Uses of data
The main use of these statistics is to provide Ministers, government departments and the wider public with a comprehensive picture of the latest trends in age 16-18 participation and NEET.
Reference dates
The estimates relate to a snapshot of activities at the end of the calendar year. The reference dates of the various post-16 sources are taken as close to the end of the calendar year as possible:
| Source | Reference date |
|---|---|
| Population | January |
| Schools | January |
| Further Education Institutions (FEI) | November |
| Apprenticeships/Work Based Learning (WBL) | January |
| Higher Education Institution (HEI) | December |
| Labour Force Survey | October to March (average of two quarters) |
Time series comparability
The data in this publication has a consistent time series going back to 1994 for participation in education and apprenticeships, albeit reflective of any policy changes.
Wider training and NEET rates are also presented back to 1994. However, there is a discontinuity in the timeseries from 2019 (see Revisions to Labour Force Survey data section).
Overseas pupils
This publication excludes learners studying overseas. Overseas students studying in English FE and English HE are included in the national figures. Learners from Wales, Scotland and Northern Ireland are included in the national figures for schools (maintained & CTCs, Academies, free schools) and FE, but not included in HE national figures.
National FEI figures include all 16 to 18 year olds participating in education and training in England, whether resident in England or not.
Developments made to these statistics
Since the accreditation of these official statistics as National Statistics in March 2012 (opens in new tab), the following developments have been made to improve them for users:
From 2025 publication
- Change in methodology relating to missing responses in the Labour Force survey. Predominantly impacting labour market status of those at age 16. Now aligns with ONS/DfE/DWP harmonised approach.
- Inclusion of entry levels from 2023 as a highest qualification aim category, previously these were classified within ‘Other quals’.
From 2024 publication
- Better classification of study in HE institutions captured in the ILR.
From 2020 publication
- More accessible underlying data provided through the EES platform.
- Inclusion of T levels following their launch in September 2020. T Levels are an alternative to A levels, apprenticeships and other 16 to 19 courses. Equivalent to 3 A levels, a T Level focuses on vocational skills and can help students into skilled employment, higher study or apprenticeships.
From 2019 publication
- improvements in the way we present our data in the statistical commentary with the intention of making this more clear, concise, insightful and engaging.
From 2018 publication
- New underlying data format.
Previous revisions:
- inclusion of Tech levels, Applied general qualifications and Tech certs in tables presenting highest study aim
- inclusion of state-funded school types to include participation in academies and free schools.
Underlying data provided alongside publications
Further information is available
Users should be aware that participation figures for young people and estimated of those who are NEET and NET are published in other statistics releases. The table below provides a summary of the four related releases and gives information on their content.
| Title | Participation in education, training and employment | NEET age 16-24 | Young people not in education, employment or training (NEET) | Local authority NEET and participation |
|---|---|---|---|---|
| Producer | Department for Education | Department for Education | Office for National Statistics | Department for Education |
| Status | Accredited Official Statistics | Official Statistics in development | Official Statistics in development | Transparency data |
| Age range | 16-18 | 16-24 | 16-24 | 16-17 |
| Age type | Academic age[1] | Academic age[1] | Actual age | Academic age[1] |
| Country | England | England | UK | England |
| Regional breakdowns | No | Yes (2022 and prior) | No | Yes |
| LA breakdown | No | No | No | Yes |
| Data type | Mostly administrative | Survey | Survey | Management information |
| Frequency of publication | Annually | Annually | Quarterly | Annually |
| Seasonally adjusted | No | No | Yes | No |
| When to use?2 | England Participation and NEET figures, age 16-18 | England/regional NEET and NET figures, age 16-24 (includes reasons NEET) | UK NEET figures, age 16-24 (published quarterly so often most timely) | LA/regional participation and NEET figures, age 16-17 (includes pupil characteristics) |
- Academic age is defined as ‘age at the start of the academic year’ i.e. age as at 31 August. Actual age is defined as ‘respondents age at the time surveyed’.
- Arrows indicate recommended order of preference in which the statistics should be used based on most users’ needs and robustness of the data.
In addition:
| Further information | |
|---|---|
| Destinations of young people after Key Stage 4 and Key Stage 5 | The destination measures statistics publication shows the percentage of young people continuing in education, on apprenticeships or in employment after completing Key Stage 4 and Key Stage 5. These are based on data from the National Pupil Database matched to Individualised Learner Record data, Higher Education Statistics Authority data and employment and benefits data from Her Majesty’s Revenue and Customs (HMRC) and Department for Work and Pensions (DWP). |
Figures for Wales, Scotland and the UK | The participation and NEET statistics in this publication only refer to information about institutions in England. For information on Wales, Scotland, Northern Ireland and the UK overall, contact the departments below or access their statistics at the following links: UK: ONS Labour Market Statistics Wales: Post-16 Education and Skills Scotland: Scottish Government Statistics and Research Northern Ireland: Norther Ireland statistics and Research Agency |
Confidentiality
The Code of Practice for Official Statistics requires we take reasonable steps to ensure that our published or disseminated statistics protect confidentiality.
As data in this release is at national level and no pupil characteristics other than sex are provided then pupils are not identifiable so no disclosure control is required. This is consistent with the Departmental statistical policy. (opens in new tab)
Differences in proportions quoted in text are calculated from unrounded data and therefore may not always be the same as differences calculated from rounded tables.
Related policy
| Policy summary | Detail |
|---|---|
| 'Raising Participation Age (RPA)', legislation was introduced in 2013/14 requiring 16/17 year olds in England to remain in education or training. | Introduced in two stages it applied to: • Young people who left year 11 in summer 2013, who were required to stay in some form of education or training for at least a further year until 27 June 2014; • Young people who started in year 11 (or years below) in September 2013, who were required to continue until at least their 18th birthday. The first cohort impacted by stage 1 of Raising the Participation Age (RPA) legislation were academic age 16 (usually year 12) in 2013/14 (end 2013 figures in this statistics publication) and academic age 17 in 2014/15 (end 2014 figures). Those young people impacted by stage 2 of RPA were academic age 16 in 2014/15 (end 2014 figures) and age 17 in 2015/16 (end 2015 figures). Although participation estimates in this release do not include a measure strictly aligning to compliance with RPA (see next section for differences), the proportion reported as being in ‘education and apprenticeships’ is the closest proxy. Education and apprenticeships (which includes all full and part-time education and apprenticeships but not re-engagement activities) is the headline participation measure in this release. Wider training, funded privately or by employers, which is not picked up in the administrative data collections is included in the ‘Total education and training’ measure. More detail on the differences are given in the policy section of the accompanying technical document. Estimates of participation consistent with the duty to participate under RPA, based on data collected by local authorities, are published at the following link (in Table 2) Participation in Education and Training by Local Authority. It should be noted that as the local authority estimates are based on different data and methodology to those in this statistics publication, they are not directly comparable. |
| There are differences between activity that complies with the duty to participate under RPA and what is captured in this publication | Activity that satisfies the duty to participate under RPA legislation is described in detail in the statutory guidance to Local Authorities. In summary, young people in full-time education or apprenticeships automatically meet the duty to participate, but in order to comply with RPA, part-time education for academic age 16 year olds: (i) must include planned qualification guided learning hours of a minimum 280 hrs per year; (ii) should usually be combined with full-time employment or voluntary work (either 20 hrs per week or 40 hrs over 2 weeks for those with less regular hours). In this publication, participation that is not full-time is automatically counted as part-time, irrespective of planned hours or whether it is combined with employment. This will mean that RPA-compliance will be significantly lower than the proportion of 16 year olds reported as being in education and work-based learning. However, this will be partially offset as 16 year olds engaged in LA approved re-engagement activities will satisfy the duty to participate but the activity might not be recorded in this publication. |
| 16 to 19 funding: maths and English condition of funding | From August 2014 students who have not achieved a good pass in English and/or maths GCSE by age 16 must continue to work towards achieving these qualifications or an approved interim qualification as a ‘stepping stone’ towards GCSE as a condition of student places being funded. Full time students who started their programme on or after 1 August 2015 who have prior attainment of a grade 3 or grade D in GCSE or equivalent in maths and/or English must study a GCSE to meet the condition of funding. For further information see 16 to 19 funding: maths and English condition of funding on GOV.UK. |
| Technical education reform and the post 16 skills plan | Published in July 2016, the post-16 skills plan set out the previous Conservative Government’s plan to support young people and adults to secure skilled employment and meet the needs of the economy. Based on recommendations by Lord Sainsbury’s independent panel, the ambition is that every young person, after an excellent grounding in the core academic subjects and a broad and balanced curriculum to age 16, is presented with two choices:
The academic option is already well regarded, but the technical option must also be world-class, improving both the quality of education and student choice. A framework of 15 routes across all technical education was introduced, grouping together occupations to reflect where there are shared training requirements. Rather than the previous crowded landscape of overlapping qualifications, only high-quality technical qualifications which match employer-set standards are approved. From September 2015, each occupation cluster had approved:
|
| Launch of T Levels | T Levels are new 2-year courses which are taken after GCSEs and are broadly equivalent in size to 3 A Levels. Launched in September 2020, these courses have been developed in collaboration with employers and education providers so that the content meets the needs of industry and prepares students for entry into skilled employment, an apprenticeship or related technical study through further or higher education. T Levels offer students practical and knowledge-based learning at a school or college and on-the-job experience through an industry placement of at least 315 hours – approximately 45 days. The courses are available at selected colleges, schools and other providers across England. Further information can be found on Introduction of T Levels - GOV.UK (www.gov.uk) |
Feedback and user engagement
Feedback on methodology and presentation is welcomed and encouraged. If you have any comments on the information collected, the timing or format of our outputs or whether these statistics are meeting your requirements, please email: post16.STATISTICS@education.gov.uk
Help and support
Contact us
If you have a specific enquiry about Participation in education, training and employment age 16 to 18 statistics and data:
Post-16 statistics team
Email: post16.statistics@education.gov.ukContact name: Sally Marshall
Press office
If you have a media enquiry:
Telephone: 020 7783 8300
Public enquiries
If you have a general enquiry about the Department for Education (DfE) or education:
Phone: 0370 000 2288
Opening times:
Monday to Friday from 9.30am to 5.30pm (closed on bank holidays)