This document provides background information on the Department for Education’s (DfE's) NEET age 16 to 24 statistics. It explains concepts used in this publication and the method used to calculate estimates. It provides an overview of the data sources and other relevant information.
NEET age 16 to 24: methodology
- Published
Introduction
Coverage
The data used in this publication covers young people who reside in England, and is based on their academic age as of 31st August. The publication’s underlying data contains sex and labour market status breakdowns for the summary age groups 16 to 17, 16 to 18, 16 to 21, 16 to 24, 18 to 21, 18 to 24 and 19 to 24, as well as labour market status breakdowns (but not sex breakdown) by individual age. The publication also includes NEET and NET rates by region for 16 to 24 year olds. Further breakdowns by age group and region have not been provided due to small sample sizes and uncertainty of estimates.
For the 2023 release some of these breakdowns, such as individual age, were omitted from the underlying data as there were concerns with the sample sizes in the Labour Force Survey (LFS). From 2024, these breakdowns were reinstated following a reweighting exercise, however estimates for all breakdowns should always be considered alongside their associated confidence intervals.
As a result of user feedback and internal review, from March 2018 DfE changed the periodicity of the England NEET age 16 to 24 publication to an annual release to be published in February/March each year following the release of final quarter LFS data, relating to the October to December quarter.
Quarterly NEET estimates for the UK (opens in new tab) are published by the Office for National Statistics. They differ to the figures in the DfE NEET age 16 to 24 as they are for the whole of the UK, are based on calendar age and are seasonally adjusted.
Data sources
Labour Force Survey
The Labour Force Survey (LFS) is a survey of households living at private addresses in the UK. Its purpose is to provide information on the UK labour market which can then be used to develop, manage, evaluate and report on labour market policies. In England, the survey is managed by the Social Surveys division of the Office for National Statistics (ONS).
Not in education, employment or training (NEET) and not in education or training (NET) estimates are calculated using a harmonised methodology agreed between ONS, the Department for Education (DfE), the old Department for Business, Innovation and Skills (BIS) and the Department for Work and Pensions (DWP).
NEET estimates are calculated by first deriving a variable to distinguish those in education or training (ET) from those not in education or training (NET). Then by cross tabulating the derived ET/NET variable by economic status (in employment, unemployed or economically inactive) and also by age and gender, a NEET estimate can be calculated. A small number of ‘missing’ cases are split in line with the responses given by young people of the same age, gender and economic activity.
Full details about the Harmonised NEET Methodology are published in the technical specification (opens in new tab).
The series provides quarterly estimates of NEET and NET amongst young people from the LFS and the results are not directly comparable with DfE’s definitive measure found in the national statistics release ‘Participation in education, training and employment age 16 to 18’ (more information on this below).
The estimates provide data on the trends in NEET and NET for young people aged 16 to 24 compared to the ‘Participation in education, training and employment age 16 to 18’ statistical release which just covers those aged 16 to 18. The latter release should be used for the department’s definitive estimates for the 16 to 18 age group, further detail on this release is given below.
Trends in NEET and NET from the quarterly LFS data should be assessed by comparing the current time period with the same time period in the previous year, to account for seasonal effects. For example, October to December figures should not be compared with January to March figures. In addition the NET series should be used as context for any NEET data.
More information about the LFS in general can be found in the ONS user guide (opens in new tab).
Annual Population Survey
The Annual Population Survey (APS) is a continuous household survey, covering the UK comprising 12 months of survey data.
The APS is not a stand-alone survey; it uses data combined from 2 waves of the main Labour Force Survey (LFS), collected on a local sample boost. Due to boosted sample sizes, the APS allows more robust analysis of sub groups such as by characteristics or lower level geography.
Further information on the APS can be found here. (opens in new tab)
Participation in education, training and employment age 16 to 18 official statistics release
The Participation in education, training and employment age 16 to 18 (opens in new tab) release contains definitive estimates for the number and proportion of 16 to 18 year olds participating in education, training and employment and of those NEET in England. The estimates relate to a snapshot of activities at the end of the calendar year.
Information is drawn together from various post-16 data sources to give a coherent and comprehensive picture of participation, including schools, further education, work-based learning and higher education.
| The primary sources for participation and NEET estimates are: | The Schools' Census Pupil Level Annual Schools’ Census The Individualised Learner Record (ILR) Higher Education Statistics Agency (HESA) Higher Education Students Early Statistics (HESES) Labour Force Survey Mid-year estimates and projections of population from the Office for National Statistics (ONS) |
|---|
The key analyses are by age, gender, type of learning, institution type, labour market status and highest qualification being studied.
These are the Department for Education’s definitive measures of participation for 16 to 18 year olds, and sets recent changes in the context of historical trends. These measures are used to monitor progress against the Department’s objectives of raising participation and reducing the number of young people NEET (not in education, employment or training).
For further information please see the methodology document alongside the latest Participation in education, training and employment age 16 to 18 statistical release.
Other published sources
Client Caseload Information System (CCIS) Regional NEET
The CCIS figures are an estimate of the number and proportion of 16 and 17 year olds who are NEET in each local authority in England.
The estimates relate to a 3 month average snapshot estimate of the regional NEET rate taken from the Local Authority CCIS data.
These estimates are not directly comparable to the LFS or Participation statistics release. The estimates depend on the quality of each local authority’s data collection. The data only includes young people who are known to their local authority (usually those who were educated in government-funded schools).
Estimates of NEET in the CCIS data are reported alongside proportions whose current activity is not known to incentivise local authorities to ensure all their young people are tracked.
For more information go to the NEET data by local authority webpage:
NEET and participation: local authority figures (opens in new tab)
Definitions
| Labour market status | Criteria |
|---|---|
| A person is considered to be in education or training if any of the following apply | Enrolled on an education course and are still attending or waiting for term to (re)start Doing an apprenticeship On a government supported employment or training programme Working or studying towards a qualification, or Had job-related training or education in the last 4 weeks |
| In employment* | All people in some form of paid work, including those working part-time |
| Unemployed* | People who have been looking for work in the past 4 weeks and who are available to start work within the next 2 weeks |
| Economically inactive* | People who have not been looking for work and/or who are not available to start work. This includes those not looking for work because they are students and those who are looking after dependants at home |
| NEET | Anybody who is not in any of the forms of education or training listed above and who is not in employment is considered to be NEET. As a result, a person identified as NEET will always be either unemployed or economically inactive. |
*The definitions of labour market status are based on those recommended by the International Labour Organisation (ILO).
The NEET age 16 to 24 release includes a time series on the economic activity of those NEET using variable ILODEFR - Basic economic activity (ILO definition):
(1) In employment
(2) ILO unemployed
(3) Inactive
(4) Under 16
The variable INECAC05 is used to classify those whose economic activity was reported as ‘Inactive’ in ILODEFR. The following table shows classification of those inactive:
| Inactive: looking after family/home' | Inactive: long-term or temporarily sick | Inactive: other reason |
|---|---|---|
| 7 Inactive - seeking, unavailable, looking after family, home | 8 Inactive - seeking, unavailable, temporarily sick or injured | 6 Inactive - seeking, unavailable, student |
| 14 Inactive - not seeking, would like work, looking after family, home | 9 Inactive - seeking, unavailable, long-term sick or disabled | 10 Inactive - seeking, unavailable, other reason |
| 25 Inactive - not seeking, not like work, looking after family, home | 15 Inactive - not seeking, would like work, temporarily sick or injured | 11 Inactive - seeking, unavailable, no reason given |
| 16 Inactive - not seeking, would like work, long term sick or disabled | 12 Inactive - not seeking, would like work, waiting results of job application | |
| 26 Inactive - not seeking, not like work, temporarily sick or injured | 13 Inactive - not seeking, would like work, student | |
| 27 Inactive - not seeking, not like work, long term sick or disabled | 17 Inactive - not seeking, would like work, believes no jobs available | |
| 18 Inactive - not seeking, would like work, not yet started looking | ||
| 19 Inactive - not seeking, would like work, does not need or want employment | ||
| 20 Inactive - not seeking, would like work, retired from paid work | ||
| 21 Inactive - not seeking, would like work, other reason | ||
| 22 Inactive - not seeking, would like work, no reason given | ||
| 23 Inactive - not seeking, not like work, waiting results of job application | ||
| 24 Inactive - not seeking, not like work, student | ||
| 28 Inactive - not seeking, not like work, believes no jobs available | ||
| 29 Inactive - not seeking, not like work, not yet started looking | ||
| 30 Inactive - not seeking, not like work, does not need or want employment | ||
| 31 Inactive - not seeking, not like work, retired from paid work | ||
| 32 Inactive - not seeking, not like work, other reason | ||
| 33 Inactive - not seeking, not like work, no reason given |
The APS person data from 2012 has been used to look at the health conditions of 16-24 year olds NEET. As explained in the data sources section, the APS has been used as boosted sample sizes allow more robust analysis of sub groups.
The variable ‘HEALTH20 - Main health problem[1]’ has been used and categorised in line with ONS Nomis[2] health conditions as below:
| NOMIS category | APSP ‘HEALTH20’ variable |
|---|---|
| Problems or disabilities connected with arms, legs, hands, feet, back or neck | (01) Problems or disabilities (including arthritis or rheumatism) connected with... arms or hands (02) ....legs or feet (03) ....back or neck |
| Difficulty in seeing or hearing | (04) Difficulty in seeing (while wearing spectacles or contact lenses) (05) Difficulty in hearing (06) A speech impediment |
| Blood or circulatory problems, stomach, liver, kidney or digestive problems, diabetes | (09) Heart, blood pressure or blood circulation problems (10) Stomach, liver kidney or digestive problems (11) Diabetes |
| Depression, mental problems and nervous disorders | (12) Depression, bad nerves or anxiety (15) Mental illness, or suffer from phobia, panics or other |
| Skin conditions, epilepsy, other progressive illnesses & other health problems | (07) Severe disfigurement, skin conditions, allergies (08) Chest or breathing problems, asthma, bronchitis (13) Epilepsy (16) Progressive illness not included elsewhere (e.g. cancer, multiple sclerosis, symptomatic HIV, Parkinson’s disease, muscular dystrophy) (17) Other health problems or disabilities |
| Learning difficulties, Autism | (14) Severe or specific learning difficulties (mental handicap) (18) Autism (including Autism Spectrum Condition, Asperger syndrome) [3] |
[1] HEALTH20 is the main health condition reported from the HEAL question. The HEAL question is only asked for those who responded 'Yes' to LNGLST: 'Do you have any physical or mental health conditions or illnesses lasting or expecting to last 12 months or more?'
[2] Nomis (opens in new tab) is a service provided by the Office for National Statistics (ONS), to give free access to the most detailed and up-to-date UK labour market statistics from official sources.
[3] The “Autism (including Autism Spectrum Condition, Asperger syndrome)” category was introduced to the APS in January 2020 as part of the HEALTH20 variable replacing HEALTH. As a result, in 2020, a bridging variable was created to produce aggregate responses for the whole year. We do not know which category individuals with these conditions would have reported as under the HEALTH variable or what impact the introduction of this category has had on responses. In 2020 there were 66,000 individuals (5% of those with a health condition) that reported in the Autism category, which we have included in the broader category “Learning difficulties, Autism”. Prior to 2020 this category named “Learning difficulties” which respondents with Autism may or may not have reported as depending on their interpretation of their health condition.
Time series comparability
The first LFS in the UK was conducted in 1973 and the survey was carried out every two years in the spring quarter (March-May) until 1983. Between 1984 and 1991 the survey was carried out annually and consisted of two elements: a quarterly survey of approximately 15,000 private households, conducted in Great Britain throughout the year and a "boost" survey in the spring quarter between March and May, of over 44,000 private households in Great Britain and 5,200 households in Northern Ireland. In 1992 the sample in Great Britain was increased to cover 60,000 households every quarter enabling quarterly publication of LFS estimates.
Prior to spring 2000, the ’QULNOW’ variable (currently working/study towards qualification indicator), was not fully populated. A comparable time series is therefore only available from Q2 2000. However, it should be noted that due to changes in the LFS questionnaire over time, different versions of syntax are required to create this comparable time series.
Reweighting
Labour Force Survey (LFS) datasets are routinely reweighted in line with population estimates. In recent years there have also been several reweighting exercises to address changes in international migration and impacts as a result of the coronavirus (COVID-19) pandemic.
In July 2021, a new weighting variable was introduced, PWT20, to LFS datasets from January to March 2020, followed by PWT22 applied to LFS datasets from January to March 2020 in summer 2022. These reweighting exercises had minimal impact on NEET rates at ages 16 to 24.
In 2023 a new weighting variable, PWT23, was introduced for data from July to September 2022 onwards, which incorporated latest estimates of the size and composition of the UK population. As a result of the lower sample sizes and the limited reweighted LFS data available, the NEET age 16 to 24: 2023 release did not include estimates for single ages nor breakdowns of labour market status for grouped ages other than the overall 16- to 24 age group.
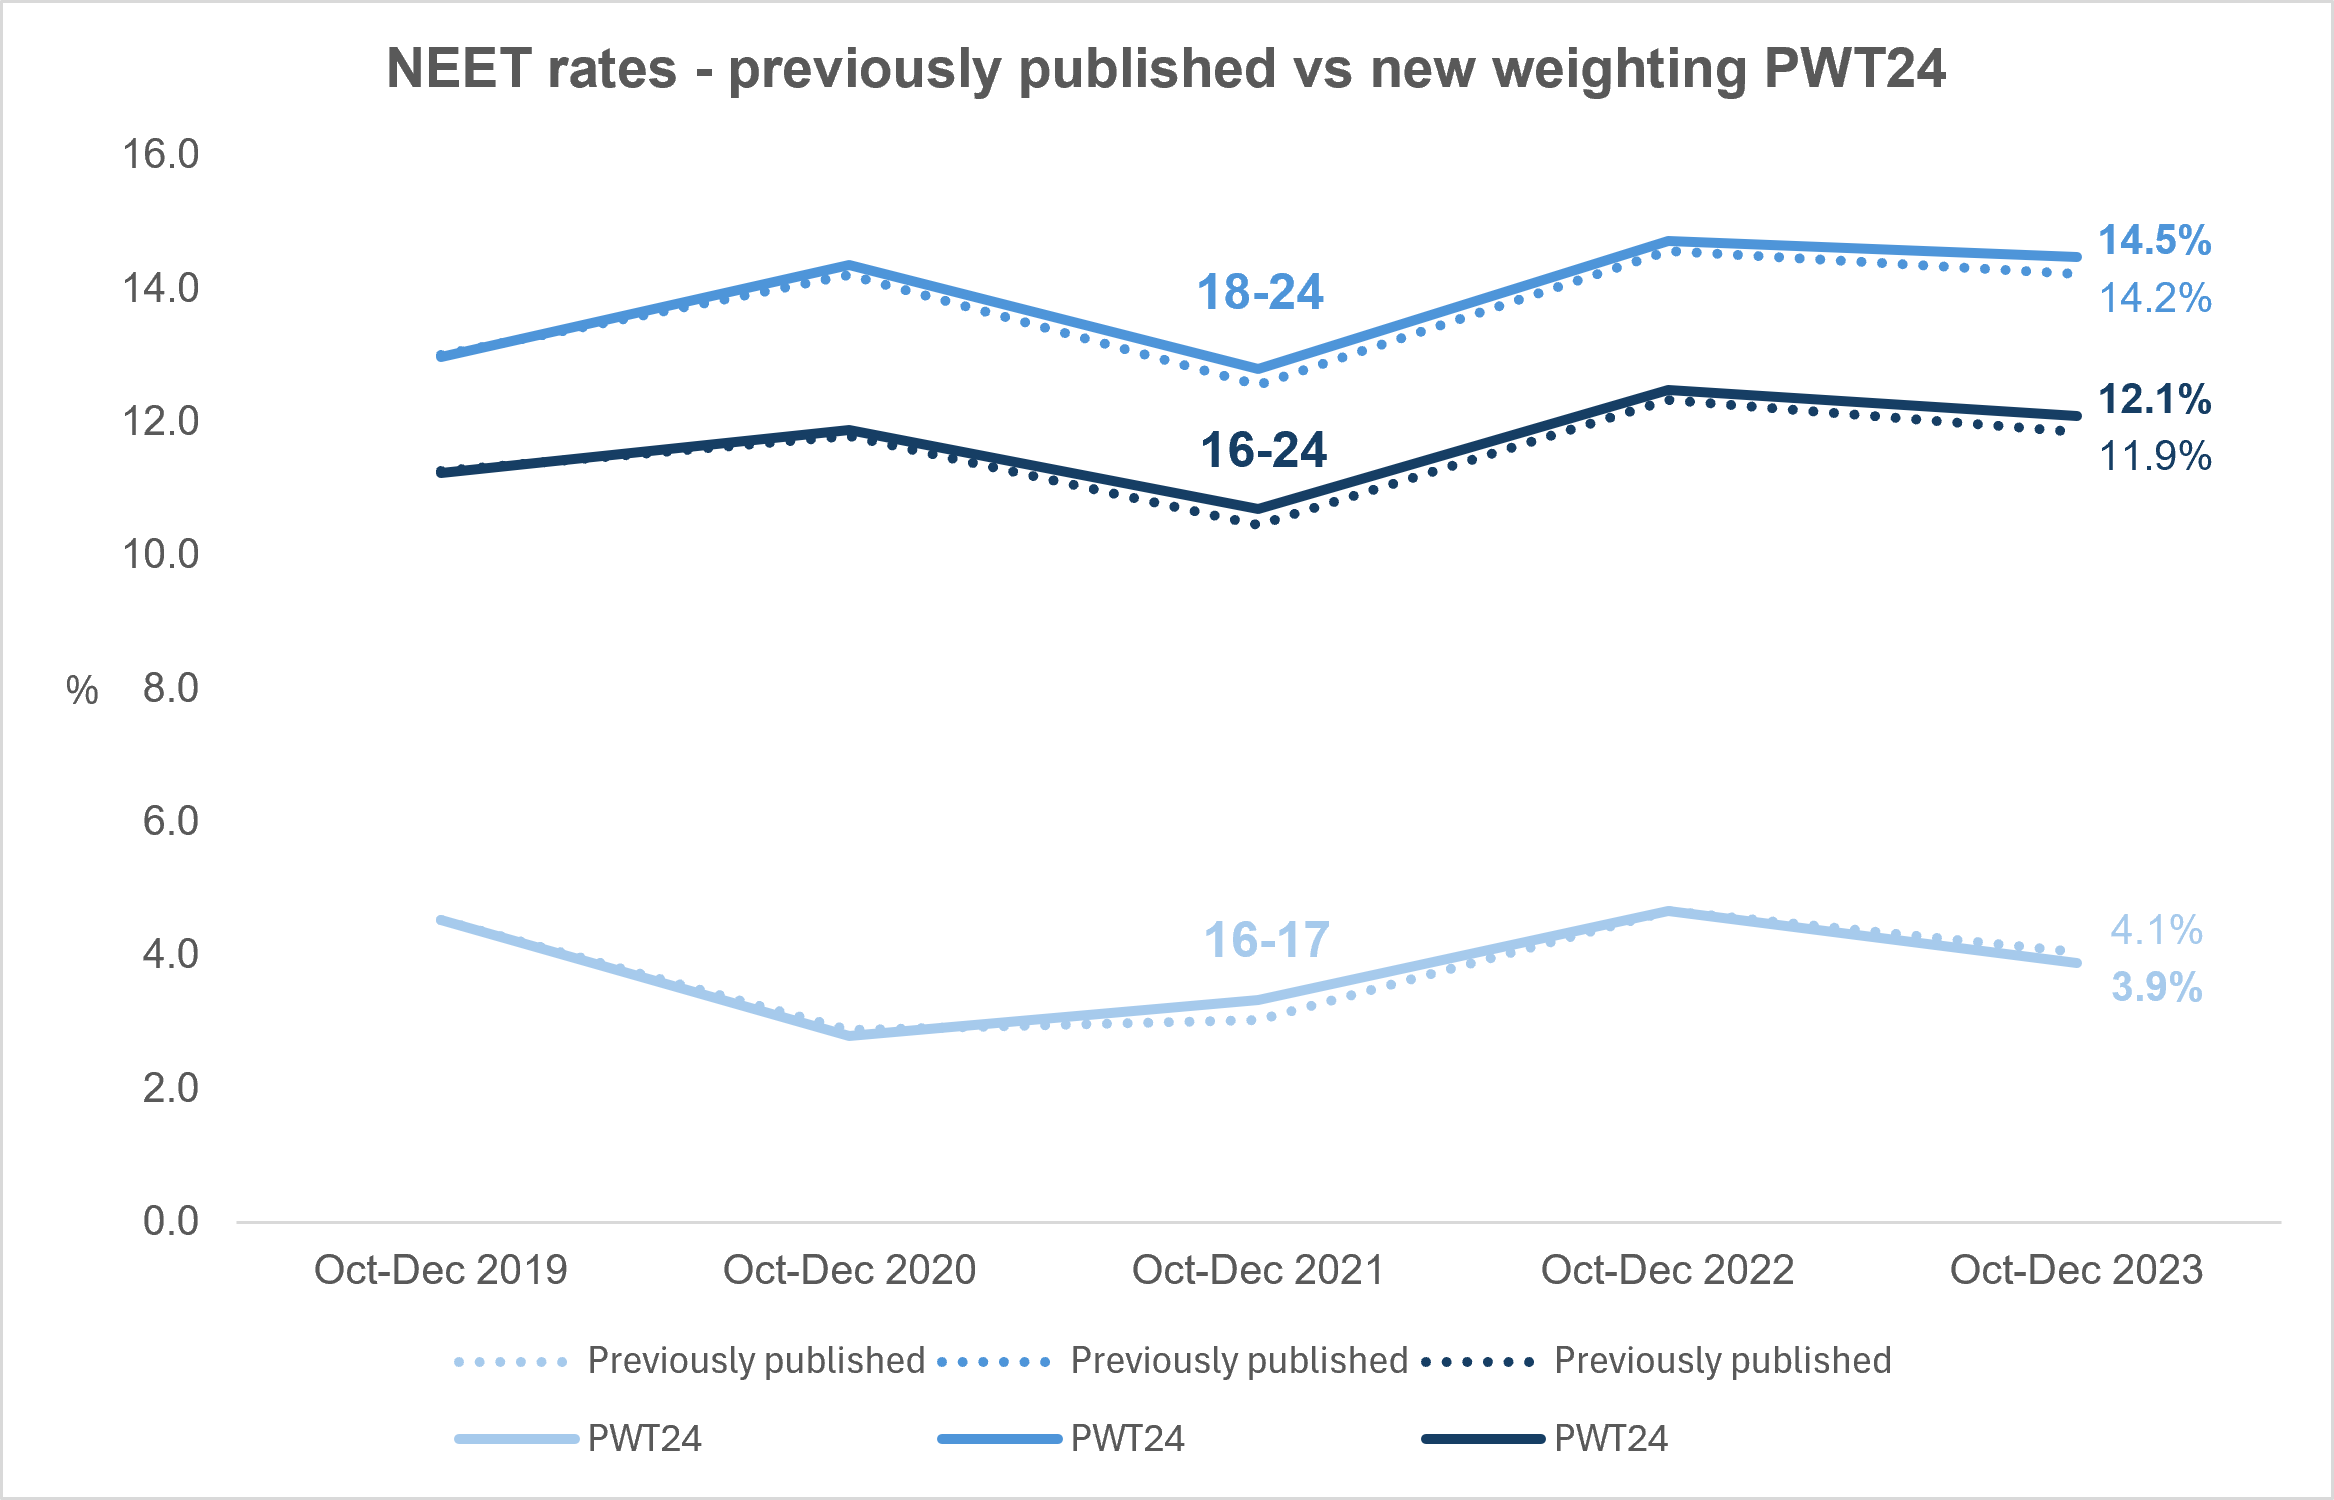
In December 2024, the LFS was reweighted from quarter 1 2019 to use more recent population estimates (2022 mid-year) adding a new weighting variable PWT24 . This latest reweighting exercise creates a discontinuity between estimates prior to and after quarter 1 2019. However, the re-weighting exercise has had minimal impact on NEET rates and they follow a very similar trend to those previously published.
More information on the method for these weights and their impact can be found in the article below:
PWT24 reweighting: Impact of reweighting on Labour Force Survey key indicators - Office for National Statistics (opens in new tab)
Details of historic reweighting can be found at the following links:
PWT23 reweighting (opens in new tab)
PWT22 reweighting (opens in new tab)
PWT20 reweighting (opens in new tab)
APS
Additional health categories
Prior to 2020 the APS did not include the category for “Autism including Autism Spectrum Condition, Asperger syndrome”. From the 2020 release onwards the “Reasons NEET” analysis has used this additional category to refine how we classify “mental health” from “other health condition”. This refinement has been applied to the data from previous years in the 2020 release and onwards.
Adjustments to APS weights (2024 data)
In summer 2025 an issue was identified relating to the application of non-response adjustment for boost cases. This affected the weights for the APS dataset covering the period October 2023 to September 2024. APS data for 2024 in the NEET age 16 to 24: 2024 release will therefore slightly differ to the APS data for 2024 in subsequent publications.
Coronavirus and measuring the labour market
Because of COVID-19 and the suspension of face-to-face interviewing on 17 March 2020, the ONS had to make operational changes to the LFS, particularly in the way that they contact households for initial interview, which moved to a “by telephone” approach. These changes resulted in a response where certain characteristics have not been as well represented as previously. This is evidenced in a change in the balance of type of household that the ONS are reaching. In particular, the proportion of households where people own their homes in the sample has increased and rented accommodation households has decreased.
To mitigate the impact of this non-response bias, in October 2020 the ONS introduced housing tenure into the LFS weighting methodology for periods from January to March 2020 onwards. While not providing a perfect solution, this redressed some of the issues that had previously been noted in the survey results. More information can be found in Coronavirus and its impact on the Labour Force Survey (opens in new tab) and in a blog (opens in new tab). In accordance with this ONS advice, this publication has moved to using the new tenure weights for the headline labour market measures for periods from January to March 2020 onwards.
Sample sizes and variability
Sample sizes
Over the last two decades, there has been a decreasing trend in response rates for the Labour Force Survey (LFS). For the period October to December (Q4), the response rate was at its lowest in 2023 with just 2,379 responses for England 16-24 year olds. However, in the last two years, the sample size has increased and in 2025 (Q4) there were 5,333 recorded responses for England. Although this improvement of sample size is welcome, the response rate still falls short of rates seen in earlier years (see table below). Ongoing challenges with response rates means that LFS-based labour market statistics are now badged as official statistics in development (opens in new tab) until further review.
As a result, additional caution should be taken when interpreting results and estimates should be considered alongside associated confidence intervals. However, if an annual change is stated as statistically significant we can remain confident that there has been a fall/rise in that measure.
There are numerous reasons for smaller sample sizes given by ONS which include:
- the public's willingness to participate in government surveys and levels of trust in government
- concerns over confidentiality
- difficulty in gaining access to buildings or gated communities
- general fatigue with calls and surveys
- lack of time to spend responding to surveys
- changes to household structures and people's living circumstances
More recently, since the onset of the pandemic in 2020, surveys like the LFS which are designed to be collected through face-to-face interviews have been seriously hampered. In addition recruitment of interviewers has also changed significantly since the pandemic.
The LFS has been undergoing a transformation programme, with one key aim being to develop it as an online-first multi-mode survey, to ensure it is as easy as possible for respondents to engage. This would notably impact the age group 16 to 24 who would be most likely to respond online.
| Q4 | Population | Sample size | % of population sampled |
|---|---|---|---|
| 1992 | 5,822,352 | 15,022 | 0.26% |
| 1993 | 5,633,156 | 14,120 | 0.25% |
| 1994 | 5,449,801 | 13,354 | 0.25% |
| 1995 | 5,343,926 | 12,907 | 0.24% |
| 1996 | 5,246,420 | 12,560 | 0.24% |
| 1997 | 5,170,815 | 11,789 | 0.23% |
| 1998 | 5,116,183 | 11,464 | 0.22% |
| 1999 | 5,115,861 | 11,025 | 0.22% |
| 2000 | 5,120,456 | 10,240 | 0.20% |
| 2001 | 5,276,125 | 11,016 | 0.21% |
| 2002 | 5,390,454 | 10,433 | 0.19% |
| 2003 | 5,501,867 | 10,184 | 0.19% |
| 2004 | 5,626,970 | 10,038 | 0.18% |
| 2005 | 5,696,875 | 9,656 | 0.17% |
| 2006 | 5,801,810 | 9,526 | 0.16% |
| 2007 | 5,890,788 | 9,757 | 0.17% |
| 2008 | 5,944,334 | 9,469 | 0.16% |
| 2009 | 5,956,804 | 9,102 | 0.15% |
| 2010 | 6,000,096 | 8,556 | 0.14% |
| 2011 | 6,049,219 | 8,289 | 0.14% |
| 2012 | 6,002,160 | 7,725 | 0.13% |
| 2013 | 6,001,992 | 7,909 | 0.13% |
| 2014 | 6,024,643 | 7,640 | 0.13% |
| 2015 | 5,981,447 | 7,222 | 0.12% |
| 2016 | 5,926,427 | 6,748 | 0.11% |
| 2017 | 5,838,860 | 6,463 | 0.11% |
| 2018 | 5,762,415 | 6,018 | 0.10% |
| 2019 | 5,778,924 | 5,522 | 0.10% |
| 2020 | 5,844,787 | 4,616 | 0.08% |
| 2021 | 5,831,098 | 4,824 | 0.08% |
| 2022 | 5,918,341 | 3,417 | 0.06% |
| 2023 | 6,062,602 | 2,379 | 0.04% |
| 2024 | 6,153,446 | 3,851 | 0.06% |
| 2025 | 6,297,395 | 5,333 | 0.08% |
Sampling variability
Surveys, such as the LFS, provide estimates of population characteristics rather than exact measures. In principle, many random samples could be drawn and each would give different results, due to the fact that each sample would be made up of different people, who would give different answers to the questions asked. The spread of these results is the sampling variability, which generally reduces with increasing sample size. For example, with a 95% confidence interval, it is expected that in 95% of the survey samples, the resulting confidence interval will contain the true value that would be obtained by surveying the whole population.
Confidence intervals based on simple random sampling are presented in this release to give an approximation of the sampling variability.
Statistical significance
If a comparison between two estimates is statistically significant, we can be 95% sure that the change reflects reality and is not a result of sampling variability.
Rounding
All numbers are unrounded in the underlying data files alongside this release. Percentages are presented to one decimal place and any annual changes in percentages are calculated on unrounded data.
Underlying data provided alongside publications
The following underlying data files have been published alongside the NEET brief tables:
| File name | Content |
|---|---|
| NEET_and_NET_estimates_from_the_LFS | Quarterly time series from Q2 2000. National NEET, NET and labour market status estimates for 16 to 24 year olds in England broken down by (academic) age. Sex breakdowns for all summary age groups. Regional NEET and NET estimates for 16 to 24 year olds. Corresponding 95% confidence intervals. Estimates are all unrounded. |
| NEET_Primary_health_condition_estimates_from_the_APS | Annual time series from 2012. National NEET and NET estimates for 16 to 24 year olds broken down by health condition. |
| neet_and_net_other_sources_comparisons | Summary NEET estimates from the Department for Education's “NEET age 16 to 24” and "Participation in education, training and employment" annual release, the “National Client Caseload Information System” and the Office for National Statistic's quarterly “Young people not in education, employment or training (NEET)” release used to provide comparison between the different NEET measures. |
Please see accompanying underlying data metadata specification document for further information.
This data is released under the terms of the Open Government License and is intended to meet at least 3 stars for Open Data.
Uses of data
The main use of these statistics is to provide Ministers, government departments and the wider public a comprehensive picture of the latest trends from the Labour Force Survey in NEET and NET for ages 16 to 24.
Revisions
We do not plan to make any revisions to this publication. If we later discover that a revision is necessary, this will be made in accordance with our revisions policy.
However, the LFS is periodically re-weighted, which affects historical estimates. When such re-weighting takes place, a revised historical series will be reflected in the next NEET age 16 to 24 release but previous editions will not be retrospectively revised. Hence, for the latest historical series only the most recent publication should be used.
Also, latest figures referenced in this release from the ‘Participation in education, training and employment age 16 to 18’ accredited official statistics publication are provisional. When the figures are finalised for the previous year, these revisions will be reflected in future NEET age 16 to 24 releases.
Publication timetable
| Data | Period Covered | Published |
|---|---|---|
| NEET age 16 to 24 | Jan-Mar (Q1) | Annually, approximately 6 weeks after the Q4 reporting period i.e. mid-March |
| Apr-Jun (Q2) | ||
| Jul-Sep (Q3) | ||
| Oct-Dec (Q4) | ||
| Participation in education, training and employment age 16 to 18 | End of calendar year snapshot. Comparable period with Q4 from LFS | Annually, following June i.e. End 2024 published end June 2025 |
Further information is available
| Related publication | Details |
|---|---|
| Wales | The Welsh Assembly Government (WG) publishes an annual release which is produced in a similar way to DfE’s ‘Participation in education, training and employment age 16 to 18’ release. The Participation of Young People in Education and the Labour Market is regarded as the definitive measure of NEET estimates in Wales. It covers academic age 16 to 18 and 19 to 24. The WG also publishes NEET figures based on the Annual Population Survey (APS). It covers academic age 16 to 18 and 19 to 24. |
| Scotland | The Scottish Government (SG) publishes an annual release based on the Annual Population Survey (APS) Labour Market Statistics for 16 to 24 year olds. This publication contains the latest estimates of employment, unemployment and economic inactivity for 16 to 24 year olds. The SG also publishes Annual school leaver statistics which are used to give the proportion of young people in 'positive destinations'. These estimates include some young people in part-time education. The coverage is actual age 16 to 19. |
| ONS | ONS National Statistics: UK Labour Market: Monthly UK Labour Force Survey (LFS) statistics for young people not in full-time education and not in employment. Table AO6: Educational status and labour market status for people aged 16 to 24 (not seasonally adjusted). This table shows estimates for people in full-time education and people not in full-time education by labour market status, roughly equivalent to NEET (but some young people in part-time education are also included). ONS National Statistics: Young People not in Education, Employment or Training (NEETs): UK level quarterly statistics based on the Labour Force Survey (LFS). The definition of NEET corresponds to that used in this DfE NEET release, however ONS estimates are seasonally adjusted meaning quarter on quarter comparisons can be made. In addition, DfE estimates for England are based on academic age whilst ONS estimates are based on calendar age. |
| OECD | The Organisation for Economic Co-operation and Development (OECD) publishes annual NEET estimates. Their Education at a Glance UK country note publication covers young people aged 15 to 19 and 15 to 29 in the UK. |
Official Statistics in Development
These statistics are badged as "official statistics in development".
They are based on information from the Labour Force Survey (LFS) and ongoing challenges with response rates and levels mean that LFS-based labour market statistics are now badged as official statistics in development (opens in new tab) until further review. This is also in line with the letter from the Office for Statistics Regulation (OSR) (opens in new tab), stating that LFS statistics should not be published as accredited official statistics until OSR has reviewed them.
‘Official statistics in development’ means statistics that are undergoing a development. They have been produced as far as possible in line with the Code of Practice for Statistics.
This can be broadly interpreted to mean that these statistics are:
- managed impartially and objectively in the public interest
- meet identified user needs
- produced according to sound methods
- well explained and readily accessible
Find out more about the standards we follow to produce these statistics through our Standards for official statistics published by DfE guidance (opens in new tab).
Feedback and user engagement
We would welcome feedback on any aspect of this publication at Post16.STATISTICS@education.gov.uk
Help and support
Contact us
If you have a specific enquiry about NEET age 16 to 24 statistics and data:
Post-16 statistics team
Email: post16.statistics@education.gov.ukContact name: Post-16 statistics team
Press office
If you have a media enquiry:
Telephone: 020 7783 8300
Public enquiries
If you have a general enquiry about the Department for Education (DfE) or education:
Phone: 0370 000 2288
Opening times:
Monday to Friday from 9.30am to 5.30pm (closed on bank holidays)