Comparison of the results from the 2024 and 2025 pupil projection models

- Figures are reported as full time equivalent (FTE) unless specified otherwise.
- In this release, projections are only provided up to 2030 due to the increased uncertainty in migration assumptions. The projection model previously published in 2024 only provided data up to 2028 due to the increased uncertainty in fertility assumptions from 2029 onwards.
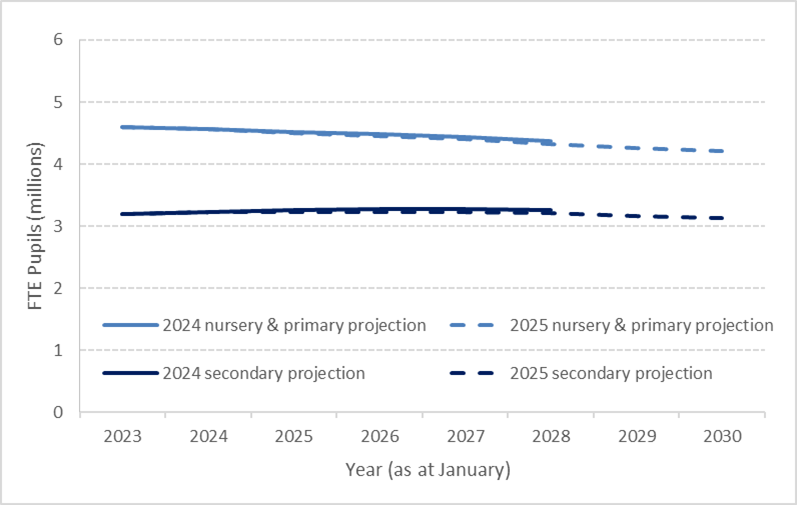
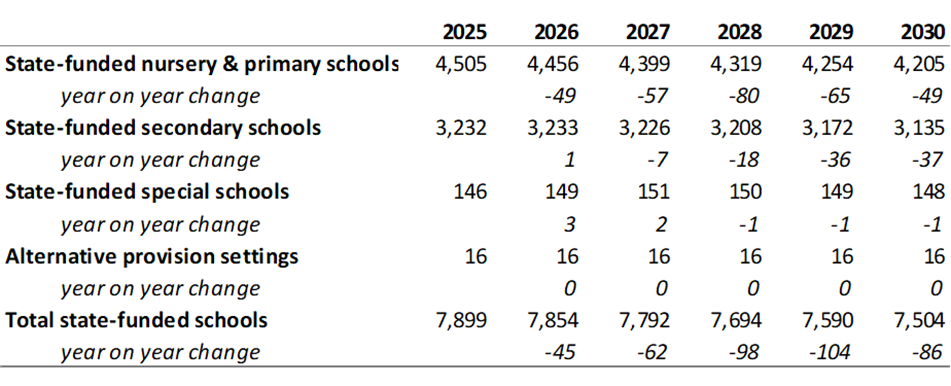
- The 2024 model showed a state-funded school population of 7,779,000 by 2028 (down 2.2% from 2024). The current model, still showing a decline, projects a population of 7,694,000 by 2028 (down 3.2% from 2024), which is 85,000 (1.1%) fewer pupils than the previous projection for 2028.
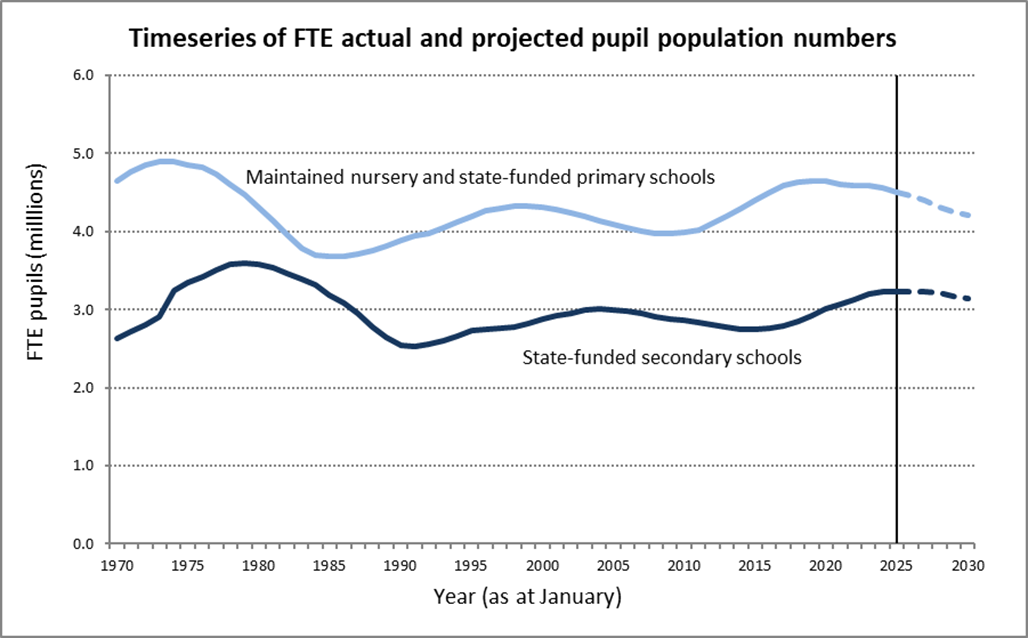
- In 2025, the actual population in state-funded schools was 7,899,000. By 2030, this is projected to decrease by 395,000 (5.0%) to 7,504,000.
The latest figures from the January school census showed that there has been a decrease of around 60,000 (0.7%) pupils across all school types from the previous year. There are fewer pupils in primary schools this year compared to last year, with little change to pupil numbers in state-funded secondary (when all through schools are included), AP schools, special schools and non-maintained schools. This is primarily driven by demographic changes, following a peak of births in 2012, as children reach secondary school age and lower numbers of pupils are moving into primary school age.
Historical and projected pupil numbers (up to and including age 15 at the start of the academic year) by main school type, England

Early years
- Early years calculations include 4-year-olds in reception class, which almost all children attend, as well as the younger ages where participation in the state-funded sector is much smaller and there are more part-time pupils.
- The FTE population of under 5-year-olds in state funded education is projected to be 771,000 in 2030. This is a 4.0% decrease from the actual figure for 2025 (803,000).
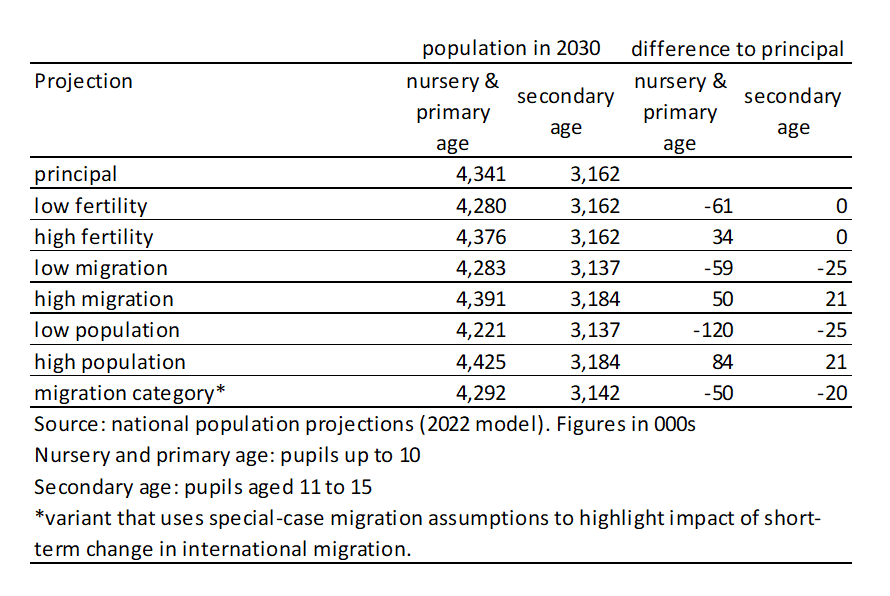
- This projected population decrease is due to lower births seen in 2023 and 2024 (mid-year to mid-year), and continued lower births projected by ONS up to and beyond the 2030 time period presented in this publication. Compared to the 2024 projection model, which projected a 4.4% (36,000) decrease in 5-year-olds between 2024 and 2028, the current model projects a faster decrease of 6.5% (53,000) over the same period. One reason for this could be that the migration assumptions in the latest ONS population data has resulted in fewer women of childbearing age than previously projected.
State-funded nursery & primary schools
- The overall pupil population in these school types is projected to be 4,205,000 in 2030. This is 300,000 (6.7%) lower than the actual population in 2025 (4,505,000).
- The revised projection for 2028 of 4,319,000 pupils represents a 5.4% fall from 2024; this is 38,000 lower than the previous forecast, as last year’s projection showed a 4.5% fall over the same period.
- The nursery & primary population is therefore still projected to drop and is doing so at a faster rate than previously projected.
State-funded secondary schools
- The secondary school population is projected to be 3,135,000 in 2030. This is 97,000 lower than the actual school population reported in the 2025 school census of 3,232,000.
- The revised projection for 2028 of 3,208,000 secondary pupils represents a 0.8% fall from 2024, and is 55,000 (1.7%) lower than last year’s projections which reverses the previously projected 0.9% increase over the same period.
- The pattern of change in the secondary school population seems to indicate that it plateaued between 2024 and 2025, will remain at a similar level until 2026, and is then projected to start declining slowly. This suggested plateau is earlier than the peak in 2026 projected last year but will be subject to change if pupil numbers bounce back, fluctuate, or continue to plateau in future years.
The actual number of secondary school pupils in 2025 fell slightly as more pupils moved out of the secondary phase than moved in. Changing historical birth rates and trends in net migration are likely driving factors.

