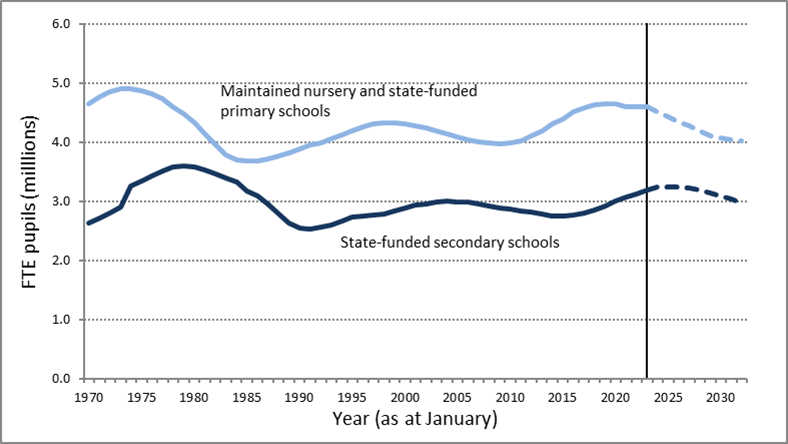
Time series of actual and projected nursery & primary and secondary pupil population (thousands)
| 2023 | 2024 | 2025 | 2026 | 2027 | 2028 | 2029 | 2030 | ||
| State-funded nursery & primary schools | 4,593 | 4,510 | 4,431 | 4,350 | 4,272 | 4,181 | 4,113 | 4,069 | |
| year on year change | -83 | -79 | -81 | -78 | -91 | -68 | -44 | ||
| State-funded secondary schools | 3,193 | 3,244 | 3,244 | 3,238 | 3,219 | 3,191 | 3,146 | 3,095 | |
| year on year change | 51 | 0 | -6 | -19 | -28 | -45 | -51 | ||
| State-funded special schools | 131 | 135 | 136 | 136 | 135 | 134 | 132 | 130 | |
| year on year change | 4 | 1 | 0 | -1 | -1 | -2 | -2 | ||
| Alternative provision settings | 13 | 13 | 13 | 13 | 13 | 13 | 12 | 12 | |
| year on year change | 0 | 0 | 0 | 0 | 0 | -1 | 0 | ||
| Total state-funded schools | 7,931 | 7,903 | 7,824 | 7,737 | 7,639 | 7,519 | 7,402 | 7,305 | |
| year on year change | -28 | -79 | -87 | -98 | -120 | -117 | -97 | ||
- The actual population in state-funded schools in 2023 was 7,931,000. This is projected to decrease by 802,000 (to 7,129,000) over the next nine years to 2032.
- The projection model published in 2022 estimated a population of 6,915,000 in 2032[1], so the updated model shows an increase of 214,000 on the total at the end of its projection period.
- As the population estimates from 2012 (which inform the rate of participation in education used for projections) have been updated, taking account of the results of the 2021 census, it is harder than usual to identify specific reasons for the difference between these two projection models. One reason could be the results of the 2023 school census, which showed higher numbers in primary school than had previously been forecast.
- The changes to the population estimates have resulted in increased participation rates for the actual years (that is, as the estimates are lower than before, but with the school census figures unchanged, the percentage of the total school age population calculated as being in school has increased). These rates are projected forwards into the projected years, where they stay broadly stable at the new, higher level.
- The following figures focus on projections up to 2028 in recognition of the increased uncertainty in projections beyond that point.
- This age group includes 4 year olds in reception class, which virtually all children attend, as well as the younger ages. Overall it has a higher proportion of children attending part-time and therefore is best reported as a full-time equivalent (FTE) population.
- On that basis the FTE population of under 5 year olds in state funded education is projected to be 762,000 in 2028. This is 7.7% lower than the actual figure for 2023 (826,000).
- This population decrease is due to the lower births, both actual to 2022 and also projected into the future. However, the decline is not as fast as forecast last year after some recovery in births was seen in 2021.
State-funded nursery & primary schools
- The overall population in these school types is projected to be 4,181,000 in 2028. This is 412,000 lower than the actual figure in 2023 (4,593,000).
- The figure for 2028 is 116,000 higher than was forecast in the model published in 2022, a difference of 2.9%.
- The nursery & primary population is therefore still projected to drop, but at a slower rate.
State-funded secondary schools
- The secondary school population is projected to be 3,191,000 in 2028. This is 2,000 lower than the total in 2023 (3,193,000).
- The figure for 2028 is 28,000 higher than was forecast in the model published in 2022, a difference of 0.9%.
- The pattern of change in the secondary school population (peaking in 2024-2025 then slowly starting to drop) is unchanged.
[1] Figure not previously published
Actual (2023) and projected pupil numbers by school type, England
