This document provides background information on the ‘National pupil projections’ release. It explains the concepts and methods used to calculate the figures and provides an overview of the data sources and other relevant information.
National pupil projections
- Published
- Last updated
See all notes (5)
Updated to include the new 2026 pupil projections
Updated to include the new 2025 pupil projections
Updated to include the new 2024 pupil projections
Updated to include the new 2023 pupil projections
Updated to include the new 2022 pupil projections
Introduction
Projection methods overview
The pupil projection model creates national projections for the number of pupils in England by age and by school phases and types. It uses population estimates (opens in new tab) and projections (opens in new tab), normally from the Office for National Statistics (ONS), information on birth registrations in England and data derived from the school census.
The model uses the most recently available population estimates and projections, based on the appropriate mid-year, as well as ONS’s monthly birth figures, as underpinning total population figures. The population estimates and projections are modified from their original mid-year basis to approximate the definitions used in the school census (a January count with pupils’ ages as at the previous 31 August).
The school census data, up to and including the model year, is used alongside the above to create participation rates. These are calculated as a series of historic school census totals measured against population estimates. This provides a starting point for the model, with the school census data informing assumptions about future proportions of the school population by type of school.
Separate figures, both historically and into the future, are calculated for part time and full time pupils.
ONS’s population projections include all usually resident persons, whatever their nationality. Long-term migrants are defined as individuals who change their country of usual residence for a period of at least a year, and in such cases their country of destination becomes the country of usual residence. Pupils who are short-term migrants, and are staying in England for less than a year, are included in the school census and are therefore reflected in the pupil projections. They are not separately identifiable.
Model frequency
These projected pupil figures are produced annually. However, they are based on ONS’s national population projections, which are normally produced every two years.
In the years where there are no new ONS projections then the pupil projections are technically an update of the previous year’s projection, with an added year of actual data, rather than a new projection in their own right.
This year is the first to use the ONS mid-2024 projections. These have been produced using a new set of demographic long-term assumptions for fertility, mortality, and migration, which are derived from analysis of past trends and through consultation with independent academic experts. Alongside a principal projection, ONS has also made variant projections available, which are based on alternative demographic assumptions. These provide an indication of uncertainty in, and the outcomes of, alternative demographic assumptions but do not represent upper or lower limits of future demographic behaviour.
2026 reporting year
The 2026 pupil projections use the latest ONS population estimates, produced by the traditional cohort component method, and their mid-2024 population projections.
ONS’s population estimates use census data - the latest being 2021 census - as a benchmark and roll forward the results each year, using actual birth and death figures and calculations by single year of age for migration. Over the ten years between censuses, ONS’s rolled-forward population estimates become less certain given the wide range of underlying assumptions. This is expected and is why, once ONS has the results of each decennial census, they rebase their population estimates for the previous ten years.
This year’s pupil projection figures use the ONS principal projection which, using mid-2024 estimates as a starting point, assumes lower long-term international migration, lower future fertility and longer life-expectancy than in the previous (2022-based interim) national population projections. For more details see the ONS publications National population projections: 2024-based (opens in new tab) and National population projections quality and methods guide (opens in new tab).
Pupil counts for historical years are derived from data collected via the school census.
In 2026, the actual number of pupils in state-funded nurseries and primary schools was lower than the figure projected in last year’s pupil projection model, increasing what was already an anticipated decline. Alongside established falling birth rates, this is potentially due to recent falls in long-term international migration. See the ONS Long-term international migration, provisional: year ending December 2025 (opens in new tab) for more details.
The migration trend may also have affected the pupil population in state-funded secondary schools which in 2026 was also lower than the figure projected in last year’s pupil projection model, increasing what was already an anticipated fall.
All projections are inherently uncertain but increased uncertainty around migration and birth rates make the results of the pupil projections more uncertain than usual. To account for this, we have reviewed the methodologies used to project historical actual data into the future. For example, previously the ‘All Schools’ projection used the last five years of actual data rather than three years to even out any anomalies in the pandemic-affected school censuses of 2021 and 2022.
Key drivers to change in the projections
The school census data is measured against the ONS population figures to create participation rates (both overall and for the different school types) for each historic year. The participation rates from the last three to five years are then used to calculate the pupil numbers going forward. Changes in school census figures affect not only the year in question but the whole of the projection model.
As these pupil projections are based on national population projections, alongside participation rates, they are directly affected by the assumptions made by the ONS.
Changes in the population who are of school age are predominantly driven by changes in the birth rate rather than net immigration. However, the higher levels of migration seen in recent years did include children of school age (for example, families from Ukraine). In addition, the birth rate can be affected by any increase in the number of children born to non-UK born women (compared to those born to UK-born women) as they may have higher fertility rates[1] (opens in new tab) . The percentage of children who were born to non-UK born women increased from 24.0% of births in England in 2007 to around 35.5% in 2025. Conversely, the recent lower level of migration is likely to have the opposite effect on projections.
After a decade of increases the total number of births in England dropped in 2013, remained stable for the next three years, then dropped again. There were relatively small increases in 2021 (which was a pandemic related effect) and in 2024 but since then the number of births has decreased.
[1]See
ONS Live Births: Parents' country of birth (opens in new tab) table 6_a in 2025 edition.
Alternative scenarios
The 2024-based principal population projections for England, produced by ONS, are the basis for this projection of future trends in pupil numbers. Principal population projections are based on assumptions considered to best reflect demographic patterns at the time they were adopted. However, there are inherent uncertainties in projecting the future size of the population, particularly relating to migration which does not have a registration system (unlike births and deaths, which are recorded).
Alongside their 2024-based principal population projections, the ONS also produces several variant projection scenarios, based on alternative assumptions of future fertility, net migration, and life-expectancy. An understanding of the overall effect of the uncertainty in the population projections can be obtained by comparing the results of the principal population projections with projections based on the ONS alternative scenarios.
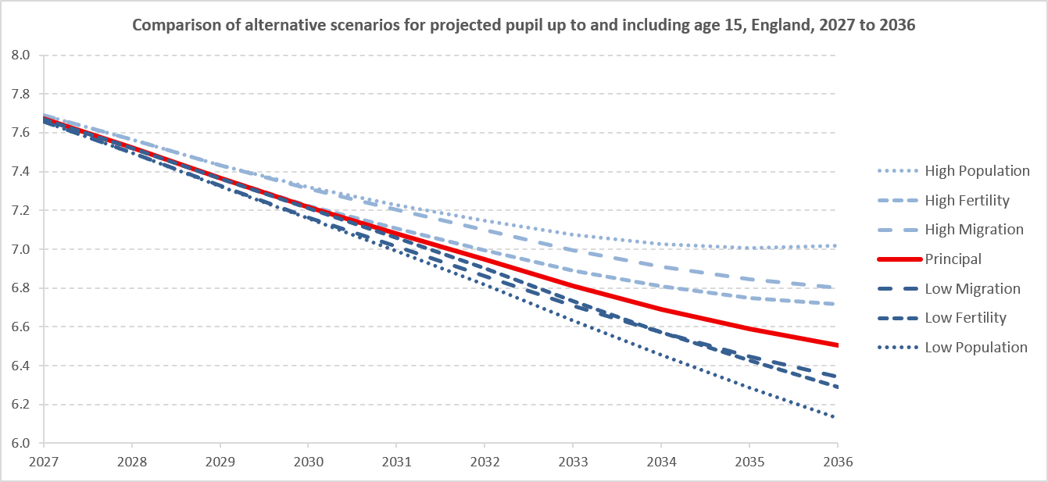
The national pupil projections examine the effect on the projected pupil population using the ONS variant projections which adopt:
a) high and low fertility assumptions;
b) high and low migration assumptions;
c) high and low population scenarios (which combine the impact of high and low fertility, net migration and life-expectancy).
These scenarios are for illustrative purposes only and are not intended to represent the upper or lower limits of projected pupil numbers.
The chart below illustrates the projections over the next ten years and shows how the uncertainty of demographic behaviour affects the outcomes of different assumptions about future population changes.
Relationship with school capacity publication
This release presents the department’s main national-level pupil projections. The department’s data on school capacity is produced by a different methodology and is an aggregation of local authorities’ own forecasts of future pupil numbers, based on their local information, such as inter-authority movement of pupils. The school capacity data provides forecasts by national curriculum year group whereas these national pupil projections forecast by actual age.
The school capacity data is published annually as an official statistical release.
The national pupil projections presented in the current release are produced within the department, at national level only. Differences in the methodologies used by individual local authorities for pupil number forecasts mean that the aggregated totals in the school capacity release will differ from the national-level projections presented here, but the trends in both are broadly similar.
Accuracy
Pupil counts for historical years have been derived from data collected via the school census.
The projected figures are subject to increasing margins of error the further into the future they run. There is also a greater level of uncertainty for smaller and more detailed categories, such as particular age bands or smaller categories of school. Factors which may contribute to differences between projections and actual data include:
- the underlying population trend, which depends on assumptions about births, mortality and migration;
- differences between short-term assumptions in the population projections, used in one model, and subsequent population estimate data incorporated into the next year’s model;
- participation for all pupils, but particularly amongst pupils aged under 5 and over 15, which may differ from the rates assumed;
- school reorganisation by local authorities, which may affect the balance between primary and secondary schools;
- variations in the proportions attending different school types, such as independent schools; and
- the introduction of new Government policies affecting schools or population.
Pupil projections rely heavily on the population projections produced by outside sources that are widely used across government for planning purposes. The projections are produced using demographic assumptions about future levels of fertility, life-expectancy and net migration, based on analysis of trends and expert advice.
Change from early projections
This release does not include projections for pupils aged 16 and over. The projections prior to 2013 were aligned to overall 16-18 participation rate projections produced for the Education Funding Agency 16-19 Funding Statement. This has been replaced with a much simpler funding letter to 16-19 education and training providers which does not include projections that are comparable with the pre-16 projections in this publication. This is a permanent change.
Consistent with the July 2014 onwards publications, this release takes out dual-registered pupils from schools classified as alternative provision settings. This removes double counting in pupil numbers from this school type, which was present in previous statistical releases. For this reason, the alternative provision data from 2002 to 2010 has been removed.
Definitions
Date of count
- Figures relate to January of the year shown.
School types
| Aggregate | School types included |
|---|---|
| State-funded schools | Total of the maintained nursery, primary, secondary, special schools and alternative provision settings |
| State-funded primary schools | Primary and middle deemed primary schools |
| State-funded secondary schools | Secondary, middle deemed secondary and all through schools, including city technology colleges, studio schools and university technical colleges |
| State-funded special schools | All special schools except non-maintained special schools and general hospital schools |
| Non-maintained special schools | Separate category of special schools which are not included in the state funded total |
| Alternative provision settings | Pupil referral units, alternative provision academies and free schools, but not other types of alternative provision |
| Independent schools | All schools that are not state funded, except non-maintained special schools |
Age
- Figures calculated in January, age as at previous 31st August.
- Under 5 – ages up to and including age 4
- Primary ages – 5 to 10
- Secondary ages – 11 to 15
Part-time and full-time equivalent
- Part-time pupils assumed to represent half of a full-time pupil to give full-time equivalent (FTE) totals.
- From 2003 to 2011 state-funded schools could record part-time pupils at any age. From 2012 pupils aged under 5 or over 15 can be recorded by state-funded schools as part-time, but all pupils aged 5 – 15 are recorded as full-time.
- Independent schools can record pupils of any age as part-time.
Help and support
Contact us
If you have a specific enquiry about National pupil projections statistics and data:
Pupils and School Finance team
Email: PupilPopulation.PROJECTIONS@education.gov.ukContact name: Dexter Roberts
Press office
If you have a media enquiry:
Telephone: 020 7783 8300
Public enquiries
If you have a general enquiry about the Department for Education (DfE) or education:
Phone: 0370 000 2288
Opening times:
Monday to Friday from 9.30am to 5.30pm (closed on bank holidays)