Teacher demand and postgraduate trainee need
Annual teacher demand trajectories, and postgraduate initial teacher trainee need for those starting training in the relevant academic year, in England.
Quick links
- Published
Headline facts and figures
Primary teacher demand in 2027/28
207,054 FTE
A fall of 8,577 (4.0% decrease) compared to 2024/25. Pupils are expected to fall by 4.9% during the same period.
Secondary teacher demand in 2027/28
218,931 FTE
A fall of 69 (0.0% decrease) compared to 2024/25 academic year. Pupils are expected to fall by 0.6% during the same period.
Total teacher demand in 2027/28
425,985 FTE
A fall of 8,646 (2.0% decrease) compared to 2024/25. Pupils are expected to fall by 3.0% during the same period.
Primary PGITT trainee need
5,520
Total 2026/27 trainee need (28% decrease on 2025/26 need)
Secondary PGITT trainee need
15,280
Total 2026/27 trainee need (21% decrease on 2025/26 need)
Overall PGITT trainee need
20,800
Total 2026/27 trainee need (23% decrease on 2025/26 need)
The teacher workforce model (TWM) is a national, stocks and flows model covering all state-funded primary and secondary schools, academies, and free schools in England [1]. The model estimates the number of teachers required for both primary and each secondary subject; and by considering the number of teachers that will leave or enter service in future, estimates the 2026/27 postgraduate initial teacher training (PGITT) trainee need to supply sufficient numbers of teachers in 2027/28.
This year, the department for education (DfE) have published a new ‘Teacher workforce analysis dashboard’ that presents a broad range of data in a user-friendly and accessible format. In particular, this demonstrates the drivers and key improvements in the teacher supply outlook that have led to a reduction in PGITT trainee need this year. The dashboard may be accessed via: Teacher workforce analysis dashboard (opens in new tab)
One of the key features of the new dashboard is the teacher demand trajectory, which is an estimate of teachers needed in future within schools that reflects projected changes in pupil numbers and the latest school workforce census data.
Primary teacher demand is projected to continue falling, reflecting a continuation of falling pupil rolls due to demographic shifts. By contrast, secondary teacher demand is estimated to remain relatively stable, in line with plateauing pupil numbers. Whilst secondary pupil numbers are forecast to start falling very slowly in the mid-2020s, teacher demand is not expected to fall rapidly as the bulge in pupil numbers moves into post-16 where class sizes are smaller than in key stage 3 (KS3) and the curriculum is broader.
The TWM uses the teacher demand trajectory to estimate the number of postgraduate trainees required in 2026/27 to deliver sufficient numbers of teachers in service in 2027/28. The overall PGITT need for 2026/27 is 20,800, a fall of 6,120 (22.7%) compared to 2025/26. This figure covers both primary and secondary; and includes those to be recruited via the high potential initial teacher training (HPITT) programme. Key drivers of this reduction in PGITT need include:
- Primary pupil numbers being projected to fall more rapidly by 2027/28, and secondary numbers beginning to fall. The new dashboard presents trends in both historical teacher and pupil numbers and how projected pupil number shifts are expected to influence future demand.
- Overall teacher retention forecasts being more favourable this year. More teachers being retained means fewer teachers are needed to replace losses. The dashboard presents current trajectories for all key inflows and outflows for the workforce and how they compare to last year’s, with many of those flows helping to improve the teacher supply outlook.
- PGITT recruitment for secondary increased from 13,550 in 2023/24 to 17,170 in 2025/26 (an increase of 3,600). If required, the TWM will adjust for under-supply resulting from the two most recent ITT recruitment rounds by inflating PGITT need. This year, the improved ITT recruitment and more favourable teacher retention trajectories result in this adjustment making a considerably smaller contribution to the secondary PGITT trainee need. By contrast, primary continues to require no adjustment given strong recent supply of teachers. [2]
- Another new feature this year is the inclusion of drivers analysis within the dashboard which estimates the individual impact of all key factors upon PGITT trainee need this year when compared to last year.
We have also included additional wider teacher workforce data to provide additional context on the current teacher supply position. These are covered in the ‘Wider teacher supply metrics’ section and have been sourced from the annual school workforce census, ITT performance profiles, and the ITT census publications. [3]
Footnotes:
[1] See the ‘The teacher workforce model’ section below for further details on coverage.
[2] More details of the under-supply adjustment can be found in ‘Further methodological details’ section of this page and the ‘Methodology for 2026 to 2027 PGITT trainee need and drivers analysis’ documentation.
[3] School Workforce publication, Initial teacher training performance profiles publication, and the ITT Census publication.
Teacher demand trajectories
Teacher demand trajectory summary
The teacher demand trajectory is an estimate of teachers needed in future within schools that reflects projected changes in pupil numbers and the latest school workforce census data. The teacher demand trajectory is used to calculate future PGITT need.
In order to provide sufficient numbers of teachers to meet demand, we estimate that a total of 425,985 primary and secondary teachers (including unqualified) will be required in service in 2027/28.
We estimate a 4.0% decrease in primary teacher demand between 2024/25 and 2027/28. This reflects changes in pupil demographics, with pupil numbers falling by 4.9% over the same time period.
Secondary teacher demand is estimated to remain relatively stable over the next few years (with only a small decrease in demand). Whilst secondary pupil numbers are forecast to begin falling in the mid-2020s, we don’t expect teacher demand to fall rapidly as the pupil bulge moves into post-16 where class sizes are smaller and the curriculum is broader. To date, secondary teacher numbers (both qualified and unqualified) have already grown by 1,430 between 2023/24 and 2024/25.
PGITT trainee need
PGITT trainee need summary
In order to provide sufficient numbers of teachers to meet demand, we estimate that a total of 413,600 qualified primary and secondary teachers will be required in service in 2027/28. We estimate that 375,300 of these can be obtained via being retained from the previous year and 25,500 will be sourced via wider recruitment routes in 2027/28.[1] The remaining 12,800 would need to be trained via PGITT. Given that some trainees do not complete training or enter employment immediately post training, this figure translates into 20,800 trainees being required to start PGITT in the academic year 2026/27. This is a decrease of 6,120 (22.7%) on the 2025/26 PGITT trainee need and includes those to be recruited via the high potential initial teacher training (HPITT) programme.
- The 2026/27 primary PGITT trainee need has fallen by 2,130 compared to 2025/26, from 7,650 to 5,520 (a 27.8% fall). This fall is principally a result of more rapidly falling pupil numbers, and more favourable forecasts for both the future retention of teachers and the recruitment of newly qualified entrants that defer entry into the profession (deferrers).
- The 2026/27 secondary PGITT trainee need increased by 345 across three subjects and decreased by 4,335 across fifteen subjects, resulting in an overall decrease of 3,990 compared to 2025/26, from 19,270 to 15,280 (a 20.7% decrease overall).
- This fall is driven by more favourable forecasts for both the future retention of teachers and secondary supply this year. Teacher supply has been helped by a boost in PGITT recruitment which is expected to deliver greater numbers of newly qualified teachers in the future. In particular, there was an increase in secondary PGITT recruitment between 2023/24 and 2025/26 of 3,600 trainees. Additionally, the Department for Education’s (DfE’s) most recent pay award is forecasted to improve teacher retention levels further and thus reduce future workforce losses.
- The expected growth of secondary teacher demand between 2023/24 and 2027/28 according to the teacher workforce model (TWM) represents the minimum contribution we expect from secondary schools to meet the 6,500 additional teachers pledge (alongside the contribution we expect from special schools and the further education sector which are not in scope of this publication).
Additional factors for PGITT trainee need changes
PGITT trainee need shifts year-on-year to reflect changes in both supply and demand. Different drivers may act upon PGITT trainee need for different subjects and do so in different directions.
- For example, overall teacher retention forecasts are more favourable this year, leading to lower PGITT trainee need for most secondary subjects. By contrast, less favourable Business Studies teacher retention forecasts this year have acted to increase the Business Studies trainee need.
- Within our model we account for under-supply resulting from the two previous year’s ITT recruitment rounds using an adjustment to inflate the PGITT trainee need if appropriate [2]. As last year, the extent of this adjustment is a key factor in determining whether the underlying 2026/27 subject PGITT trainee need increases or decreases.
- This adjustment is based on a holistic assessment of teacher supply for each subject which considers ITT recruitment, other supply routes (e.g. returners), and teacher retention over the two-year period. As a consequence of more favourable supply forecasts this year, this adjustment makes a smaller contribution to the secondary PGITT trainee need this year (around 12% of the overall need), whilst primary continues to require no adjustment given strong supply.
- For example, the Business Studies PGITT trainee need increased by 33% this year, driven by a larger under-supply adjustment being required this year. This was mostly a result of less favourable teacher retention forecasts this year (the historical leaver rate in 2024/25 was 11.1% compared to 9.9% in 2023/24 which has increased the leaver rate trajectory). Business Studies recruitment has consistently struggled to hit PGITT recruitment needs, with levels being below PGITT need since at least 2012/13 [3].
- In contrast, the Religious Education PGITT trainee need decreased by 42% this year. This is a result of a smaller under-supply adjustment this year, driven by more favourable ITT recruitment.
- For more detail on why selected PGITT trainee needs are higher/lower this year for specific subjects, please view the ‘Drivers of change in PGITT trainee need’ tab of the new Teacher workforce analysis dashboard (opens in new tab) or scroll down to the ‘Context and drivers of the 2026/27 PGITT trainee need’ section.
There are many other factors that influence both the PGITT trainee need and the under-supply adjustment, including (but not limited to): changes in teacher demand, supply forecasts for other routes into teaching which influence the need for entrants via PGITT, and both ITT completion and employment rates.
As a consequence, the teacher workforce may grow year-on-year, even if PGITT recruitment is lower than PGITT trainee need. For example, during the covid-19 pandemic qualified secondary teacher numbers grew by 12,000 (between 2019/20 and 2022/23), despite PGITT recruitment not meeting PGITT trainee need in most years over this period. This growth was largely due to leaver rates being much lower than originally expected.
How is the PGITT trainee need used?
The teacher workforce model (TWM) is a national, stocks and flows model covering all state-funded primary and secondary schools, academies, and free schools in England [4]. The model estimates the number of qualified teachers required for both primary and each secondary subject; and by considering the number of teachers that will leave or enter service in future, estimates the 2026/27 PGITT trainee need needed to supply sufficient numbers of teachers in 2027/28.
PGITT is one of many ways to get into teaching. PGITT includes: postgraduate higher education institution (HEI) courses, school centred ITT, school direct (fee-funded or salaried routes), high potential ITT, and postgraduate teaching apprenticeships.
It is important to note that recruitment to PGITT in 2026/27 is not limited for any subject. Therefore, although trainee need for certain subjects may have decreased compared to last year, this does not necessarily mean there will be fewer trainees recruited since recruitment can exceed need.
Training routes that are not covered under the PGITT trainee need include: undergraduate HEI courses, assessment only (AO), and the teacher degree apprenticeship route (a new salaried route introduced in the 2025/26 academic year) [5]. Additionally, each year we also recruit teachers that return having previously left the state-funded teaching sector (returners), and those that were already qualified but are new to the state-funded sector. For a multitude of reasons therefore, PGITT trainee need does not equate to the following years’ total new teacher entrant figures [6]. It is important to note, whilst non-PGITT routes are not included in the ITT census publication’s reported performance against the PGITT trainee need, the TWM is holistic in the way it is influenced by forecast entrant numbers from these other routes.
Footnotes:
[1] Other routes include undergraduate higher education institution (HEI) courses, assessment only (AO), the upcoming teacher degree apprenticeship, returners, new to the state-funded sector entrants, and newly qualified entrants that defer entry into the profession (deferrers).
[2] The under-supply adjustment assesses the impact of teacher retention and recruitment via all routes. The TWM uses ITT recruitment data and ITT completion and post-ITT employment rates to estimate numbers of newly qualified entrants entering the workforce following PGITT from the two ITT cycles before 2026/27. These individuals have already started ITT but are yet to enter the school workforce census. The TWM uses these estimates, and those for both wider recruitment (e.g. returners) and leavers, to estimate teacher supply in 2026/27. This is compared to estimated teacher demand to identify if enough teachers will be recruited/retained to meet the needs of schools. If there is a supply deficit, PGITT need is inflated to correct it; no adjustment is made if a surplus is estimated.
[3] The number of new entrants to initial teacher training (ITT), and performance against these postgraduate ITT trainee need is reported in the annual ITT Census publication.
[4] See the ‘The teacher workforce model’ section below for further details on coverage.
[5] See more details of the new teacher degree apprenticeships: Teacher degree apprenticeships (TDAs) | Get Into Teaching GOV.UK (opens in new tab).
[6] Phase level data on the entrants to and leavers from the school workforce are published in the annual School Workforce publication.
Wider teacher supply metrics
The teacher demand trajectory and postgraduate initial teacher training (PGITT) trainee need should be viewed in the context of wider metrics on the school workforce that provide a more holistic view of teacher supply.
These metrics may be interconnected with one another, e.g. the impact of failing to meet PGITT recruitment need in recent years has in part been offset through better-than-expected teacher retention and/or wider recruitment.
These data are the most up to date as of April 2026 and may differ to those published elsewhere if corresponding publications have been subsequently updated.
Summary
Both pupil and teacher numbers have varied throughout recent years, however the pupil to teacher ratios for both primary and secondary state-funded schools have remained relatively stable over the last 5 years as schools have adapted to changes in pupil demographics. A key driver of strong teacher supply is PGITT recruitment that has seen an increase in the 2025/26 academic year compared to 2024/25 for both primary and secondary.
Retaining experienced teachers is vital and the SWC data published in June 2025 shows improvements in teacher retention with the overall leaver rate being the lowest in over ten years, excluding the pandemic years. This is particularly positive for newly qualified teachers with more teachers staying in the profession one year after qualifying than at any point since 2010/11.
Section 1: Teacher resource levels
These are key metrics reflecting teacher levels in the state-funded schools sector and data has been sourced from the ‘School workforce in England’ publication (published in June 2025).
Pupil to teacher ratios (PTRs) are the number of pupils reported in the January school census divided by the number of qualified and unqualified teachers reported in the November school workforce census. This demonstrates the size of the workforce in relation to the size of the pupil population. An increase in PTR means an increase in the number of pupils per teacher than there were previously.
While the number of primary teachers in service has fallen, PTRs have remained relatively stable over the last decade at around 21 pupils per teacher. Secondary PTRs increased in the late 2010s due to growth in pupil numbers and have since stabilised.
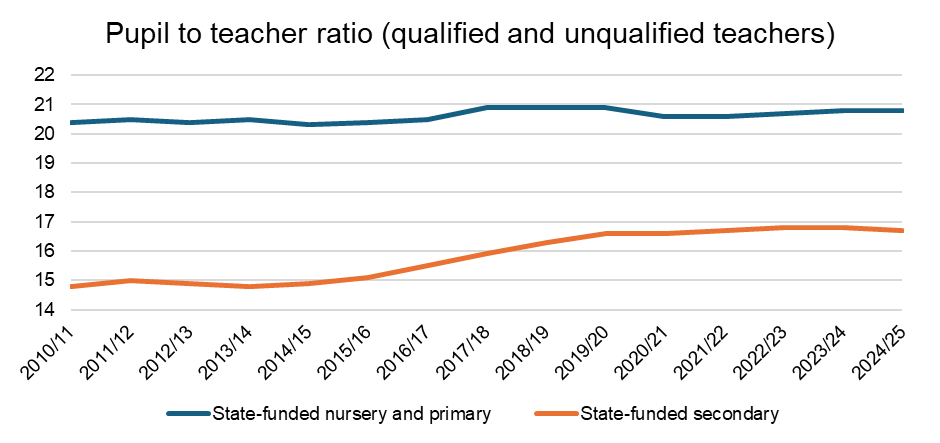
Figure 1: Pupil to teacher ratios (qualified and unqualified teachers) as reported in the school workforce census (SWC).
The proportion of teachers in service that hold qualified teacher status (QTS) has remained consistently higher than 96% since 2010/11 when the school workforce census began.
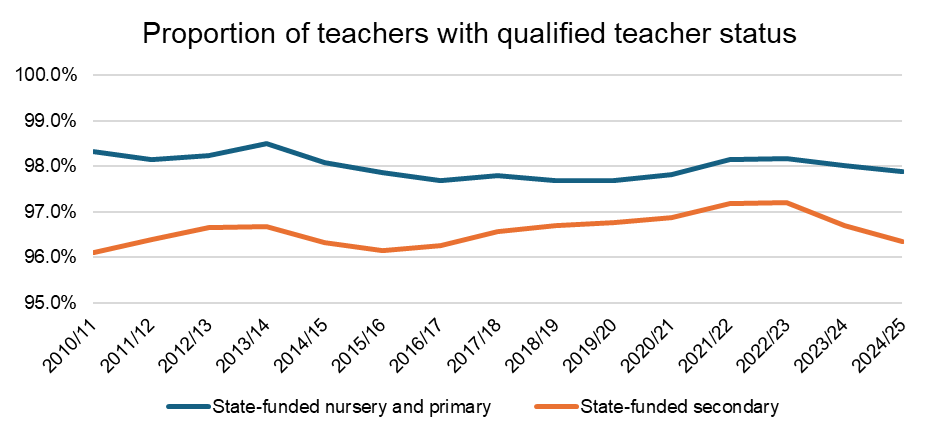
Figure 2: Proportion of teachers that are fully qualified as reported in the school workforce census (SWC).
Occasional teachers are those that are not directly employed by the school or local authority but who are in school on census day (early November each year) with a contract or service agreement lasting fewer than 28 days. The number of occasional teachers have risen substantially since 2020/21 (with a small decrease in 2023/24 compared to 2022/23). In November 2024, schools reported 16,000 occasional teachers (headcount) in state-funded nursery, primary, and secondary schools on census day. This is an increase on the previous year when 14,500 were reported.
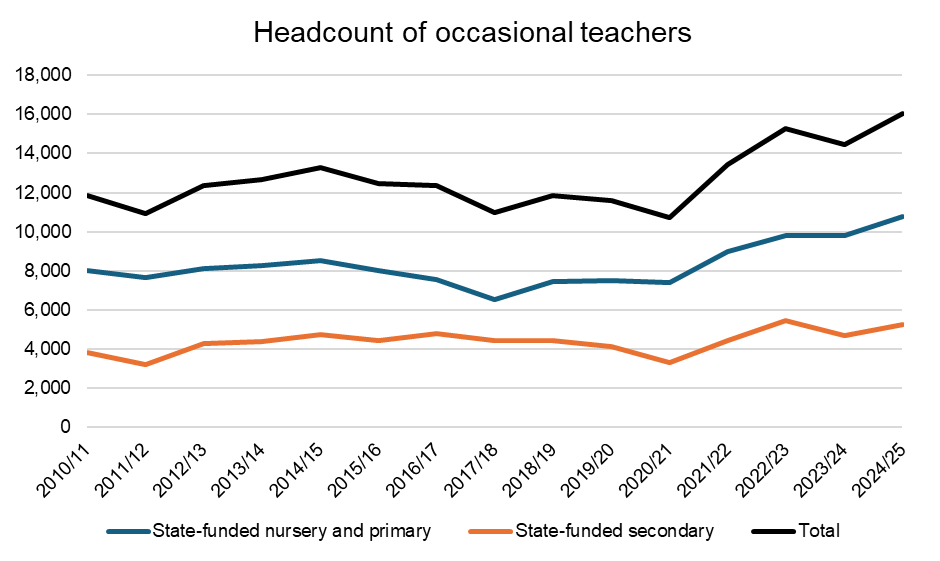
Figure 3: The number of occasional teachers as reported in the school workforce census (SWC).
Section 2: PGITT recruitment and employment
All metrics within this section relate to PGITT, both in terms of recruitment and employment outcomes.
Whilst PGITT remains the largest source of new teachers into state-funded schools it is not the only means of sourcing teachers. Consequently, whilst performance against PGITT recruitment need is an important indicator, it should not be considered as the sole measure of recruitment sufficiency.
There are promising signs in recruitment. The latest PGITT data (from the ITT Census publication published in December 2025) shows that there were 9,815 entrants to postgraduate primary ITT in 2025/26, an 11% increase from 8,853 in 2024/25. For secondary, there was a 13% increase, from 15,255 in 2024/25 to 17,174 in 2025/26, with falls only seen for Classics and English. These figures include those recruited to high potential ITT (HPITT) and self-funded trainees (see more details in the ITT census publication methodology) and have been sourced from the ITT census publication.
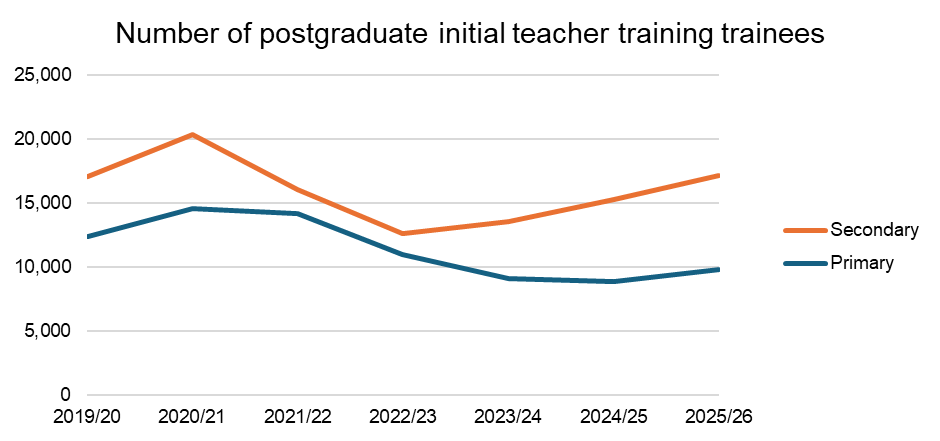
Figure 4: The numbers of trainees beginning postgraduate initial teacher training (ITT) in each academic year as reported in the ITT census
It has been particularly challenging to meet secondary PGITT recruitment need in recent years due to rising pupil numbers which have increased the demand for teachers. Excluding the pandemic, recruitment need has not been met since 2012/13, but there has been year-on-year improvement of secondary PGITT recruitment from 48% of PGITT need in 2023/24 to 61% in 2024/25 to a provisional performance against PGITT need of 89% in 2025/26.
Although the number of primary PGITT trainees recruited has been below 10,000 over the last three recruitment cycles, the statistics show that provisionally 128% of the 2025/26 PGITT need has been met.
Note - care is needed when accessing historical recruitment performance as the percentage of PGITT need met may increase or fall as a consequence of PGITT need also growing or falling over time.
From 2025/26 onwards in the ITT Census, both targets and PGITT trainees include self-funded trainees when looking at performance against targets. Prior to this academic year (back to 2019/20) ITT recruitment figures were revised to include self-funded trainees, but the targets themselves were not revised. Consequently, we use “Post graduates in scope of target” to report performance against targets to exclude self-funded trainees prior to 2025/26.
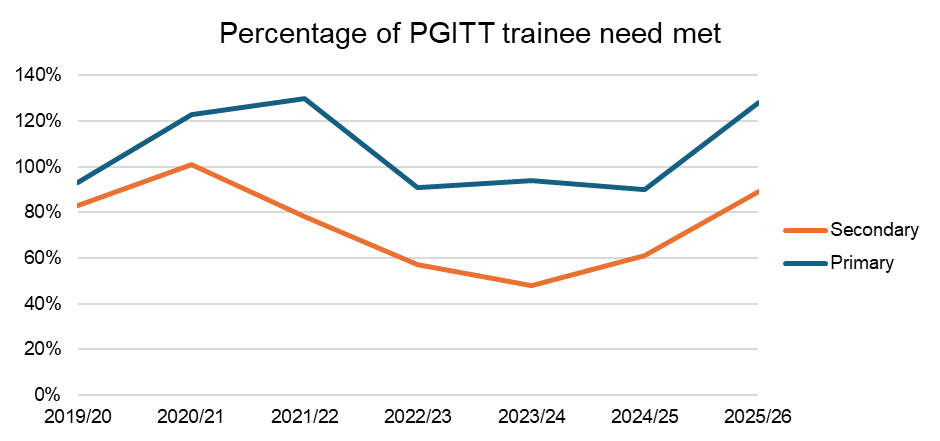
Figure 5: Percentage of postgraduate initial teacher training (PGITT) trainee need met as reported in the ITT census
Post-ITT employment rates are published for trainees within the initial teacher training performance profiles publication (published in July 2025). The rates reflect the proportion of those completing PGITT that gain employment within the state-funded schools sector within 16 months of completing training.
They differ to those published as part of the ‘Calculation of 2026-27 postgraduate initial teacher training (PGITT) trainee need and related data’ Excel workbook within this publication. Employment rates used to estimate PGITT trainee need within the teacher workforce model (TWM) are related to employment after 4 months of completing training rather than 16 months used in the ITT performance profile publication.
Employment rates for primary postgraduate initial teacher trainees awarded qualified teacher status (QTS) have remained stable at 71% to 72% for the past five cohorts.
Secondary postgraduate trainees have had higher employment rates than primary postgraduate trainees since 2019/20. Employment rates vary by secondary subject and in 2023/24, the provisional employment rates ranged from 49% for Classics to 82% for Religious Education. Classics has had the lowest employment rate out of all secondary subjects each year since 2017/18, when comparable statistics began. This is a consequence of Classics teachers being disproportionately more likely to find employment in independent schools which are out of scope of the ITT performance profiles definition of employment.
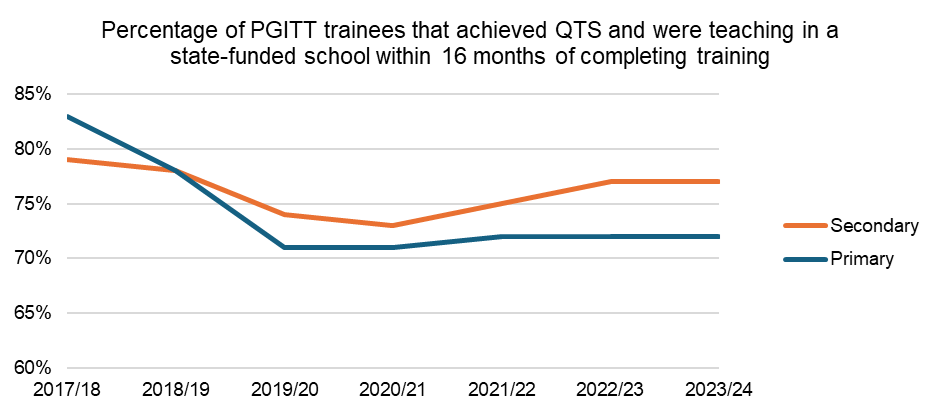
Figure 6: Percentage of trainees who achieved QTS who are teaching in a state-funded school in England within 16 months of the academic year end as reported in the ITT performance profiles publication. For 2023/24, employment rate figures are provisional (uplifted).
Section 3: Other recruitment
These metrics reflect wider recruitment and teacher vacancies. All have been sourced from the ‘School workforce in England’ publication (published in June 2025).
Data on entrants and leavers may differ slightly to those elsewhere within this publication due to coverage differences. For example, within the TWM, and calculations to estimate PGITT need, teachers leaving to and entering from special schools are considered as being ‘leavers’ and ‘entrants’ respectively for the state-funded schools sector. This is because the TWM and PGITT trainee need is focused on mainstream schools (i.e. not including the special school teacher workforce). This is not the case for the ‘School workforce in England’ publication and the entrant and leaver data in this section.
41,700 FTE qualified teachers joined state-funded school sector for 2024/25, down 1,400 since last year. This represents 1 in 11 (9.2%) of all qualified teachers. Entrants have decreased in both primary and secondary schools, however the trends in entrant types differ. In primary schools there has been a decrease in all entrant types except returners which has a small increase. In secondary schools newly qualified entrants have increased, but other entrant types have decreased.
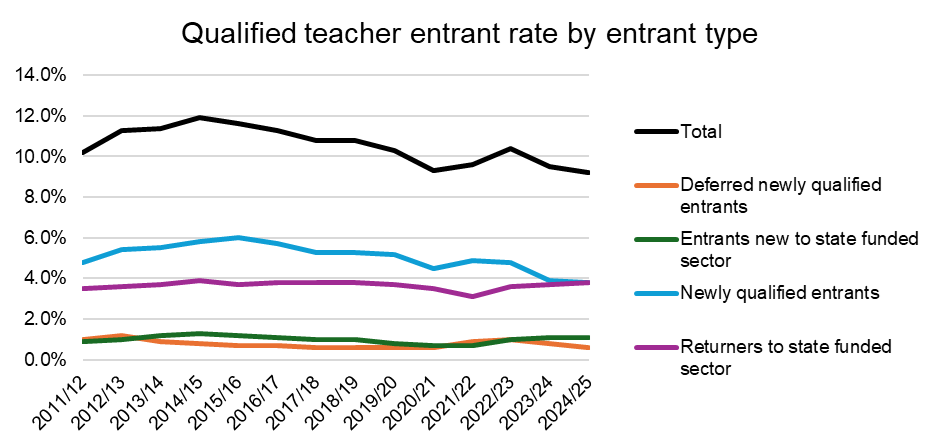
Figure 7: Qualified teacher entrant rates as reported in the school workforce census (SWC) for state-funded schools.
A vacancy is a post that has been vacant for at least one term’s duration and on the school workforce census date has been advertised but not filled. To account for changes in the teaching population the vacancies are reported per 1,000 teachers in service. Teacher vacancies (full and part-time) decreased to 2,200 in November 2024, having more than doubled in the previous three years; from 1,100 in November 2020 to a peak of 2,800 in November 2023. Additionally, the vacancy rate also decreased to 5 per 1,000 teachers in service in 2024, from 6 per 1,000 teachers in 2023.
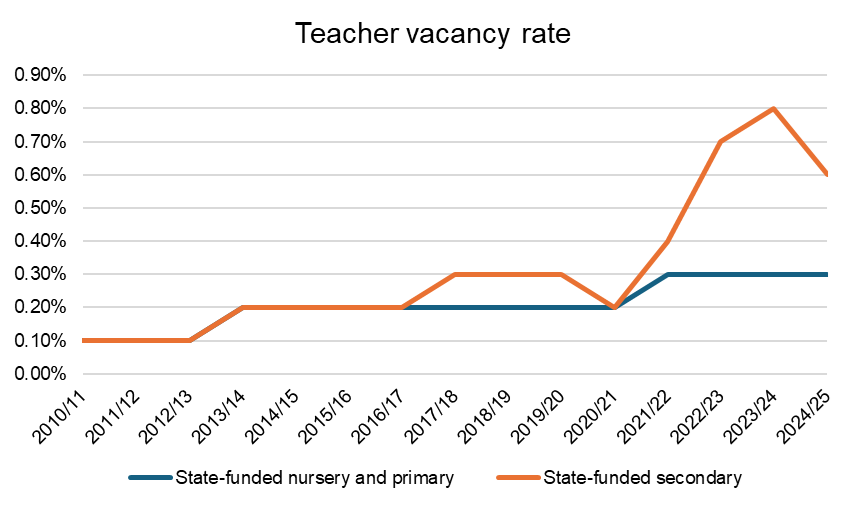
Figure 8: Teacher vacancy rates as reported in the school workforce census (SWC).
Section 4: Teacher retention
Metrics within this section cover teacher retention and specifically the retention of early career teachers. All data has been sourced from the ‘School workforce in England’ publication (published in June 2025).
Retaining experienced teachers is vital for the supply of expert teachers in schools. This year’s SWC data shows improvements in teacher retention with the overall leaver rate being the lowest in over ten years, excluding the pandemic years.
40,800 FTE teachers left the state-funded sector in 2023/24, a decrease compared to 42,600 in 2022/23 (1,700 fewer). This represents 1 in 11 (9.0%) of all qualified teachers. The majority (91%) left due to leaving the state-funded sector in England, for example due to a change of career or joining other education sectors in England or abroad. The remaining leavers were due to retirements and a very small number of deaths in service.
In 2023/24 the leaver rate was 9.0% (across state-funded schools), down from 9.3% in 2022/23. Outside of 2019/20 and 2020/21 (during the pandemic), this was the lowest since the start of the SWC in 2010/11.
These rates relate to teachers that leave service between academic years and exclude parental or sickness leave.
To note, a teacher that leaves service between the November 2023 and November 2024 SWC is classified as being a 2023/24 leaver in the School Workforce publication. By contrast, in the TWM, such leavers are classified as being leavers in the 2024/25 academic year.
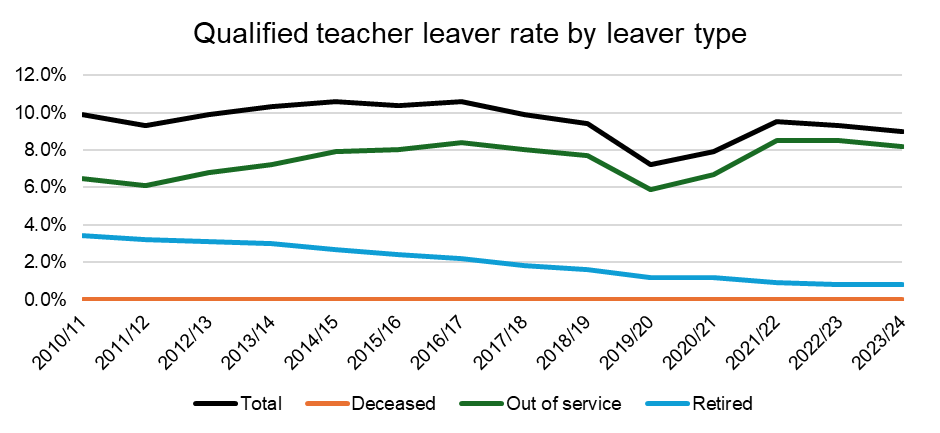
Figure 9: Qualified teacher leaver rates as reported in the school workforce census (SWC) for state-funded nursery, primary, and secondary schools.
Encouragingly, more teachers are staying in the profession one year after qualifying than at any point since 2010/11. However, data shows there is room to improve retention especially for other groups of teachers. For example, the retention of teachers 3 and 5 years after qualifying remains historically low compared to the school workforce census back series.
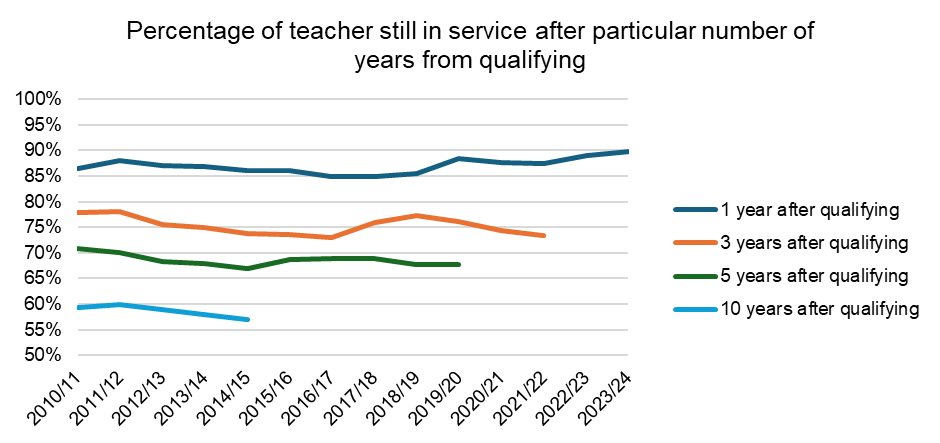
Figure 10: Proportion of teachers across state-funded schools still in service a selected number of years after qualifying as reported in the school workforce census (SWC).
Section 5: Subject-level metrics
The metrics within this section relate to individual secondary subjects. The specialism data has been sourced from the ‘School workforce in England’ publication.
The ratio of teachers per 1,000 pupils (Table 1) has been calculated as the number of secondary teachers (covering both qualified and unqualified teachers) for each secondary subject for every 1,000 secondary pupils in state-funded schools. They have been calculated using data on teacher numbers by subject and secondary pupils from the teacher workforce model.
The number of teachers for every 1,000 pupils has fallen in recent years for almost every subject compared to a decade earlier, this reflects that overall secondary pupil to teacher ratios have grown. The values have changed to different extents in different subjects as a reflection of changes in teaching time in different subjects.
Care should be taken when comparing different subjects to each other as some subjects naturally have greater teaching demands. For example, there are disproportionately more teachers of Mathematics than of Classics as relatively few pupils are taught Classics. By contrast, Mathematics is compulsory to most secondary school pupils and has considerably greater teaching demands.
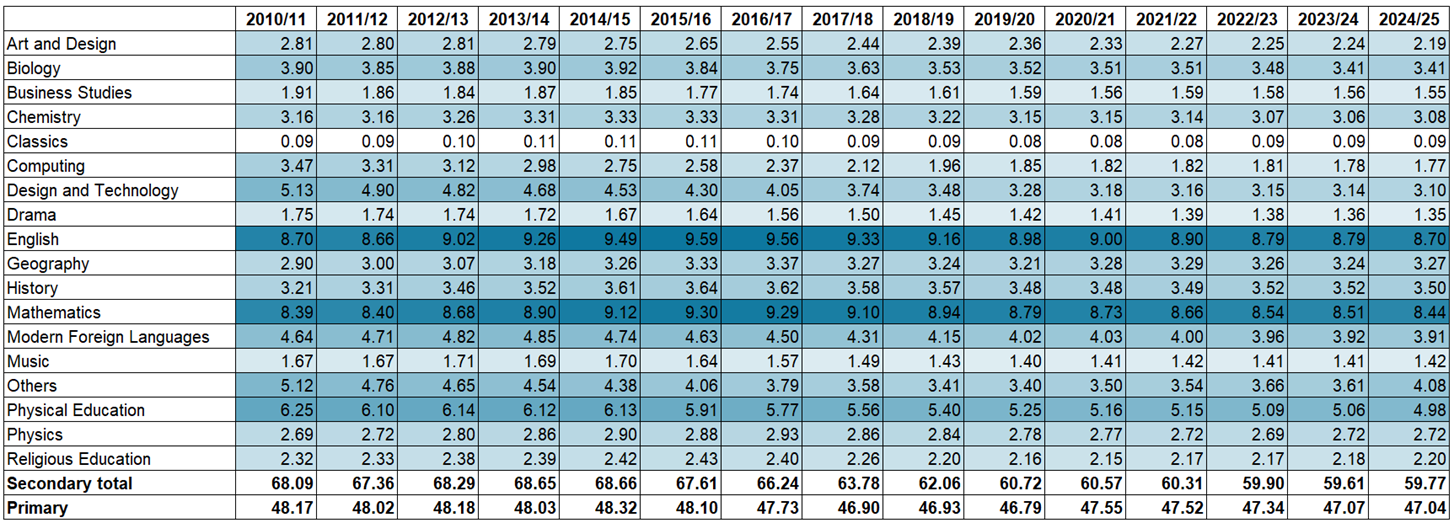
Table 1: The number of teachers per 1,000 pupils by secondary subject as published in this publication
The total number of secondary hours taught has increased since 2017/18 in line with pupil numbers.

Table 2: The number of hours taught by teachers by secondary subject as reported in this publication.
Despite higher use of occasional teachers and higher secondary PTRs, specialism rates have remained high across most subjects. To note, these specialism rates only consider teachers with qualified teacher status, as to be considered a teaching subject specialist, they must first be a qualified teacher.
Almost 9 in 10 (86.9%) of hours taught across all secondary subjects were taught by a teacher with a relevant post-A level qualification. This varies by individual subject but in each case, the majority of hours taught are by a teacher with a relevant qualification. The chart below shows the five subjects with the highest current percentage of hours taught by a specialist compared to the secondary average. The specialist rate across all science subjects, which has been provided as a comparison to general/combined science, is also consistently high.
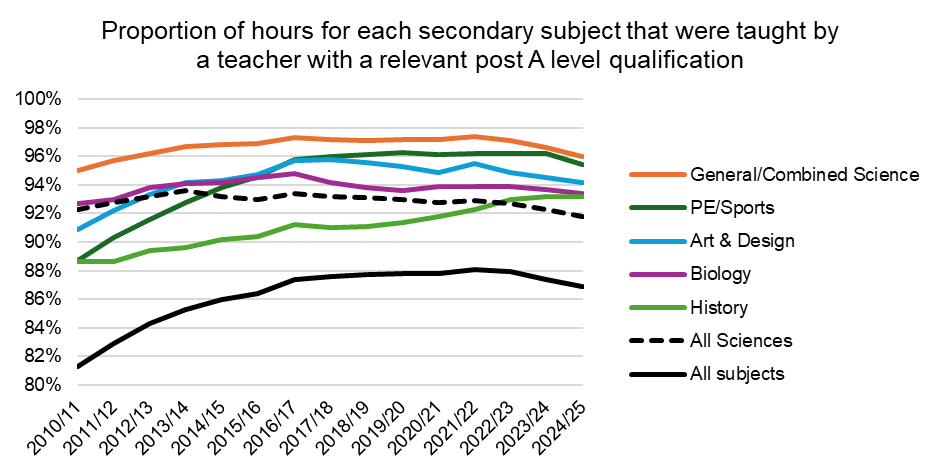
Figure 11: The proportion of teachers with a relevant post A-level qualification for the subject taught as published in the school workforce census (SWC) for the highest 5 subjects compared to the secondary average.
The chart below shows the five subjects with the lowest current percentage of hours taught by a specialist compared to the secondary average. The rate across all Modern Foreign Languages has also been provided as a comparison with specialism rates falling compared to that for secondary overall.
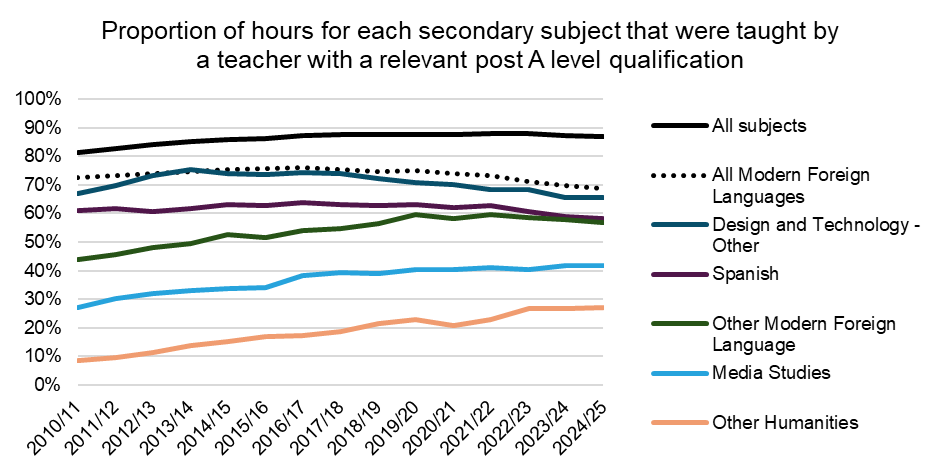
Figure 12: The proportion of teachers with a relevant post A-level qualification for the subject taught as published in the school workforce census (SWC) for the lowest 5 subjects compared to the secondary average.
To note, subjects included in the groups that are defined as ‘Other’ include:
- ‘Design and Technology – Other’ includes construction and built environment.
- ‘Other Modern Foreign Language’ includes any Modern Foreign Language excluding French, German, and Spanish.
- ‘Other Humanities’ includes humanity subjects excluding History, Geography, and Geology.
The teacher workforce model
What is the teacher workforce model?
From 2021/22 onwards, DfE’s annual postgraduate initial teacher training (PGITT) trainee need has been set using analysis from the teacher workforce model (TWM).
The TWM is a national, stocks and flows model covering all state-funded primary (including maintained nurseries attached to schools) and secondary schools (including post-16 provision within such schools), academies, and free schools [1] in England.
The model estimates the future number of qualified teachers needed by such schools beyond 2024/25 for both primary and each secondary subject; and by considering the future number of teachers that will leave or enter, estimates the 2026/27 postgraduate initial teacher training (PGITT) trainees needed to supply sufficient numbers of teachers in 2027/28.
The TWM is updated annually to use the latest available data. The school workforce census (SWC) is the key data source for the model, providing information on the composition of the current (2024/25) teacher workforce, teacher inflows/outflows, and the curriculum taught in secondary schools.
The diagram below demonstrates the scale of different flows into and out of the secondary workforce in 2024/25. Whilst newly qualified entrants from PGITT and high potential initial teacher training (HPITT) are a key aspect of teacher supply, they only comprised 4.0% of the 2024/25 secondary teacher workforce.
Inflows and outflows to the 2024/25 secondary teacher workforce
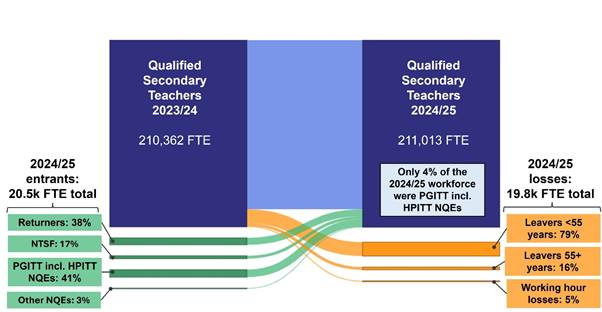
NTSF = New to state-funded, NQE = Newly qualified entrants, PGITT = Postgraduate initial teacher training, HPITT = High potential initial teacher training. Other NQEs include undergraduate initial teacher training (UGITT), assessment only (AO), and recognition of overseas qualified status.
How did the teacher workforce model estimate PGITT trainee need for 2026/27?
The text below provides a high-level explanation of how PGITT trainee need has been calculated this year. However, DfE also publish the calculations used to derive these the PGITT trainee need as part of the ‘Calculation of 2026-27 postgraduate initial teacher training (PGITT) trainee need and related data’ Excel workbook. This can be found in the ‘Supporting files’ section within the ‘Explore and download data’ tab above.
Firstly, the TWM estimated future teacher demand from a starting 2024/25 teacher stock (as measured by the SWC in November 2024) by considering projections of pupil numbers and by estimating the national pupil to teacher ratios (PTRs) needed to meet demand as pupil numbers change.
The TWM then estimated the total number of teachers (in FTE, full time equivalent) needed to join the workforce in 2027/28 to fully meet this demand. The model focussed on entrants needed in 2027/28 as these would include the newly qualified entrants trained via PGITT in 2026/27.
This 2027/28 ‘entrant need’ comprised three parts:
- The number of leavers expected in 2027/28; which the model assumes must be replaced by other teachers entering the workforce in 2027/28.
- The extra number of teachers needed in 2027/28 because of increases in teacher demand compared to 2026/27 due to pupil number growth. Note, if pupil numbers are forecast to fall between 2026/27 and 2027/28 (as for primary), the model assumes that some teachers could leave without being replaced, as teacher demand would fall in line with pupil numbers.
- Finally, the model assesses whether DfE have under recruited in the two ITT cycles prior to 2026/27. The model does not only consider the impacts of ITT recruitment, it also considers the impacts of teacher retention and the recruitment of teachers by other routes (e.g. returners). If the model estimates an overall under-supply impact, the model corrects for this by assuming that additional teachers should be recruited to counteract it.
The model takes this ‘entrant need’ and subtracts the number of entrants expected to join the workforce in 2027/28 through routes other than newly qualified entrants (NQEs) that have just completed PGITT. These include: returners, those teachers that are new to the state-funded school sector, and those NQEs that gained qualified teacher status via an assessment only route or via undergraduate ITT. The residual figure is the number of NQEs needed (in FTE form) in 2026/27 having been trained via PGITT in 2026/27.
Finally, the model upscales this number of 2027/28 NQEs into a 2026/27 PGITT trainee need (in the form of trainee headcount) by:
- Applying an FTE to headcount conversion rate that is specific to NQEs, to reflect that not all NQEs enter service working full-time, and
- Applying ITT completion and post-ITT employment rates to reflect that not all individuals who commence ITT both complete it and gain employment as an NQE in state-funded schools in England within four to six months of completing training.
Further information on the specific steps of this process is provided in the next section.
Footnotes:
[1] Whilst special schools, pupil referral units, early years, independent schools, and further education/sixth form colleges are considered as being out of scope of the TWM, the PGITT trainee need that is set using the model does make an indirect provision for teachers required in those sectors.
Context and drivers of the 2026/27 PGITT trainee need
Overview
In order to provide a sufficient supply of new teachers in 2027/28, it is estimated that 20,800 trainees are required to start postgraduate initial teacher training (PGITT) in the academic year 2026/27. This is a decrease of 6,120 (22.7%) on the 2025/26 postgraduate initial teacher training trainee need and includes those to be recruited via the high potential initial teacher training (HPITT) programme.
The drivers behind changes in trainee need vary by subject. The key factor as to whether the 2026/27 trainee needs have increased or decreased for specific secondary subjects is the extent to which trainee need has been adjusted to build in the impacts of recruitment being below trainee need in the two ITT recruitment rounds before 2026/27. This is done via the under-supply adjustments [1], which account for approximately 9% of the combined primary and secondary trainee need this year.
There are many other factors that influence both the trainee need and recruitment adjustment, including (but not limited to): changes in teacher demand, supply forecasts, and both ITT completion and employment rates. The precise drivers behind PGITT trainee need changes vary by subject; further details may be found both in this section and in the ‘Further methodological details’ section of this webpage.
Secondary subjects
The 2026/27 secondary PGITT trainee need increased by 345 across three subjects and decreased by 4,335 across fifteen subjects, resulting in an overall decrease of 3,990 compared to 2025/26, from 19,270 to 15,280 (a 20.7% decrease overall).
This fall has been driven by more favourable supply forecasts this year. In particular, there have been recent boosts to ITT recruitment (including an increase of 3,600 secondary ITT trainees between 2023/24 and 2025/26) that is expected to deliver greater numbers of newly qualified teachers in the future.
Additionally, the leaver rate trajectories are lower in this year’s TWM than last year, the result of two principal factors. Firstly, secondary leaver rates fell from 9.4% to 9.0% between 2023/24 and 2024/25. Secondly, historical leaver rates have been retrospectively revised downward in the SWC last year. This related to a data issue within the Teacher Pension Scheme extracts that inflated leavers and returners for <1,000 teachers per year that has since been resolved by the publication team.
Both these factors have resulted in the leaver rate trajectory being lower in this year’s TWM, suggesting that more teachers will be retained in future than previously forecasted.
This year’s PGITT trainee need have been set using DfE’s historical approach to setting demand. This assumes that if pupil numbers are forecasted to grow, demand for teachers would also grow, and vice versa. As secondary pupil numbers are currently forecasted to begin falling very slowly from the mid-2020s onwards, the TWM assumes that secondary teacher demand can also fall very slowly. Falling teacher demand acts to reduce this year’s lower overall secondary PGITT trainee need, as PGITT recruitment needs will be lower, all else being equal, if teacher demand is now forecasted to fall year-on-year.
Note that the pupil numbers used within the TWM slightly differ to those published in the national pupil projections (NPP). There are slight coverage differences to ensure pupils included are consistent with the methodology of the TWM. In particular, NPP numbers exclude post-16 pupils within English state-funded secondary schools.
The expected growth of secondary teacher demand (teacher demand trajectory) between 2023/24 and 2027/28 represents the minimum contribution we expect from secondary schools to meet the 6,500 additional teachers pledge (alongside the contribution we expect from special schools and the further education sector which are not in scope of this publication).
To assist in demonstrating how PGITT trainee need has fallen this year a worked example is provided below, for Physics, to show how a variety of more favourable supply forecasts have combined to lower the need for PGITT trainees in 2026/27.
Note – forecasts are produced for all subjects individually, so whilst the leaver rate forecast might be more favourable this year for some subjects, it is less so for others.
Worked example – calculating the 2026/27 Physics PGITT trainee need:
The Physics PGITT trainee need this year has fallen by 600 compared to 2025/26, from 1,410 to 810 (a 43% decrease).
- The most significant and substantial driver of this reduction has been the removal of the need for an adjustment relating to forecasted under-supply. In isolation, this acts to reduce Physics PGITT need by 492 this year.
- Last year, looking two years ahead to 2025/26 a supply deficit of 297 Physics teachers was estimated. This was derived by estimating the potential supply of Physics teachers in 2024/25 and 2025/26 by accounting for estimates of all inflows into and outflows from the workforce, and comparing this against estimated demand.
- The teacher workforce model (TWM) attempted to correct for this undersupply in 2026/27 by inflating 2025/26 Physics PGITT need by 492 trainees.
- This year, the leaver rate trajectory is lower, and more favourable. Looking 3 years ahead, the assumed leaver rate is 10.2% rather than 10.5% (0.3 percentage point decrease). This equates to retaining an extra 30 or so teachers a year and has helped to close the gap between forecasted supply and demand.
- Additionally, PGITT recruitment for Physics has become more favourable. Between 2023/24 and 2025/26, Physics PGITT recruitment increased by 94%.
- This translates to a substantial increase in forecasted numbers of newly qualified entrants. Last year, it was forecasted that there might be 795 Physics newly qualified entrants (NQEs) in 2024/25 and 2025/26. This year, helped by improved ITT recruitment, the TWM now forecasts 1,132 potential Physics NQEs in 2025/26 and 2026/27. Over two years, this equates to 337 additional potential Physics NQEs.
- With more favourable teacher retention and NQE recruitment expected, the TWM now forecasts a potential Physics supply surplus of 109 teachers in 2026/27, which compares to a deficit estimated last year of 297 in 2025/26. This removes the need to make an adjustment (of any size) relating to forecasted Physics teacher undersupply, reducing PGITT need by 492 trainees this year.
Subject level, decrease in PGITT trainee need:
The subject with the largest percentage decrease in PGITT trainee need this year is Music, decreasing by 305 trainees, from 565 to 260 (a 54.0% decrease). The key drivers of the reduction in PGITT trainee need this year are:
- A smaller under-supply adjustment being required this year as PGITT recruitment has improved. Between 2023/24 and 2025/26, PGITT recruitment increased by 55% (238 trainees in 2023/24 compared to 369 trainees in 2025/26). Whilst the proportion of PGITT need met was 65% for 2025/26, it was only 40% for 2024/25.
- Additionally, the Music teacher leaver rate trajectory is lower this year compared to last, meaning that fewer leavers need replacing by newly qualified teachers. The forecast 3 years into the future last year was 10.0% (2026/27) last year but this year it is now 8.8% in 2027/28. This is equivalent to a 1.2 percentage point decrease, equating to retaining around 60 extra Music teachers each year.
PGITT trainee need has also decreased for Physics (43%), Religious Education (42%), Drama (40%), Computing (37%), Design and Technology (36%), History (34%), Biology (31%), Geography (27%), Modern Foreign Languages (26%), Others (19%), Mathematics (13%), Art and Design (11%), Physical Education (10%), and Chemistry (5%).
The majority of these falls in PGITT trainee need are a result of smaller under-supply adjustments being required this year as a result of more favourable supply forecasts.
- Unlike last year, no under-supply adjustment was necessary this year for Mathematics, Physics, Computing, Modern Foreign Languages, Geography, Art and Design, Design and Technology, Music, and Religious Education.
For almost all subjects with lower trainee need this year we have seen a boost in ITT recruitment between 2023/24 and 2025/26 and/or more favourable teacher retention trajectories this year.
It is important to note that recruitment to PGITT in 2026/27 is not limited for any subject. Therefore, although PGITT trainee need for certain subjects may have decreased compared to last year, this does not necessarily mean there will be fewer trainees recruited since recruitment can exceed PGITT trainee need.
Subject level, increase in PGITT trainee need:
The subject with the largest percentage increase in PGITT trainee need this year is Business Studies which increased by 300 trainees, from 900 to 1,200 (a 33.3% increase). The key drivers of this change are a higher leaver rate trajectory resulting in a larger uplift being applied this year to counter estimated under-supply.
- Leaver rates are projected to be higher than assumed last year, in part because leaver rates actually grew from 9.9% in 2023/24 to 11.1% in 2024/25. The resulting forecast 3 years into the future last year was 9.6% (2026/27) but this year it is now 11.2% in 2027/28. This is equivalent to a 1.6 percentage point decrease, equating to retaining around 60-90 fewer Business Studies teachers each year.
- There is also a less favourable returner trajectory this year.
PGITT trainee need also increased for Classics (25%) and English (2%).
- The key drivers of the increase in Classics PGITT trainee need this year are a fall in PGITT recruitment and a higher leaver rate trajectory. Both of these have led to an under-supply adjustment being required this year.
- English PGITT trainee need has increased very slightly this year. Key drivers of this are a higher leaver rate trajectory this year meaning more teachers need replacing by newly qualified entrants this year, and a lower returner trajectory.
Primary
The 2026/27 PGITT trainee need for primary has fallen by 2,130 compared to 2025/26, from 7,650 to 5,520 (a 27.8% decrease). There are three key drivers of the reduction in PGITT trainee need this year:
- Teacher demand is falling more rapidly this year as pupil numbers fall more rapidly than previously forecast.
- The leaver rates trajectory is lower this year than last meaning fewer leavers need replacing by newly qualified teachers.
- Forecasts for the recruitment of deferrer newly qualified entrants are more favourable this year. Deferrer newly qualified entrants (NQEs) enter the workforce 4 to 16 months after completing training rather than within 4 months as ‘regular’ NQEs do.
To note:
In addition to the publication of the PGITT trainee need themselves, DfE have published the calculations used to derive the trainee need as part of our ‘Calculation of 2026-27 PGITT trainee need’ Excel workbook. This can be found in the ‘Supporting files’ section within the ‘Explore and download data’ tab above. Additionally, estimated impacts for key drivers of PGITT trainee need changes from 2025/26 to 2026/27 are presented in the ‘Drivers of change in PGITT trainee need’ tab of a new interactive Teacher workforce analysis dashboard (opens in new tab).
Footnotes:
[1] The under-supply adjustment assesses the impact of teacher retention and recruitment via all routes. The TWM uses ITT recruitment data and ITT completion and post-ITT employment rates to estimate numbers of newly qualified entrants entering the workforce following PGITT from the two ITT cycles before 2026/27. These individuals have already started ITT but are yet to enter the school workforce census. The TWM uses these estimates, and those for both wider recruitment (e.g. returners) and leavers, to estimate teacher supply in 2026/27. This is compared to estimated teacher demand to identify if enough teachers will be recruited/retained to meet the needs of schools. If there is a supply deficit, PGITT need is inflated to correct it; no adjustment is made if a surplus is estimated.
[2] The number of new entrants to ITT, and performance against these PGITT trainee need is reported in the annual ITT Census publication.
[3] ‘Others’ includes Child Development, Citizenship, Law, Media Studies, Other Social Studies, Other Technology, Politics, Psychology, Sociology, and Social Sciences among others.
Further methodological details
Estimating teacher demand
To estimate future teacher demand, the teacher workforce model (TWM) considers DfE’s national pupil projections by school phase and uses assumptions on how both teacher numbers and national pupil: teacher ratios (PTRs) will rise and fall with projected pupil numbers based upon historical trends.
The model assumes that as pupil numbers grow, teacher demand will grow too, and vice versa. Additionally, the model assumes that PTRs will grow in line with the historical relationship between pupil numbers and PTRs. Similarly, the model assumes that PTRs will fall if pupil numbers fall. In other words, as pupil numbers grow, the TWM assumes that schools will increase the size of the teacher workforce and allow class sizes to grow a little.
The demand for individual secondary subjects is based upon the current split of teaching time across subjects as recorded within the school workforce census.
Pupil projections are a key driver of the future demand for new teachers. All else being constant, if pupil numbers start to grow, or begin to grow at a faster rate year-on-year, then teacher numbers would also need to grow at a faster rate. Similarly, if pupil numbers were to fall, or to grow at a slower rate year-on-year, this would lead to a fall in the demand for new teachers.
Therefore, the TWM is driven by the year-on-year change rate in pupil numbers, rather than the raw pupil numbers themselves.
- The primary pupil population is forecast to fall by 1.8% in 2027/28 (on the previous year), compared to 1.3% in 2024/25 (on the previous year). As pupil numbers fall more rapidly, the demand for teachers will also fall more rapidly. This has been a key driver of recent falls in the primary PGITT trainee need.
- By contrast, secondary pupil numbers are expected to start declining slowly from 2025/26 onward. They are projected to reduce by 0.3% in 2027/28 (on the previous year) compared to an increase of 0.4% in 2024/25.
- Whilst secondary pupil numbers are forecast to fall, DfE don’t expect teacher demand to fall rapidly as the pupil bulge moves into post-16 where class sizes are smaller and the curriculum is broader.
- In isolation of other drivers, this acts to reduce the demand for secondary PGITT trainees in 2026/27.
- Historically the TWM has used national pupil projections (NPP), but these differ slightly from those published in the NPP due to slight coverage differences, to ensure that they are consistent with the methodology of the teacher workforce model. In particular, NPP numbers exclude post-16 pupils within English state-funded secondary schools. Additionally, whilst calculating 2026/27 PGITT trainee need, these have been adjusted slightly to account for the actual number of pupils captured in October 2025 via school returns in the dedicated schools grant (DSG).
Estimating future teacher leaver numbers
The TWM estimates the number of teachers who will leave the workforce between 2024/25 and 2027/28 and assumes that all leavers will need to be replaced by teachers entering the workforce.
The TWM uses forecasts of leaver rates, as the absolute number of leavers will vary depending on the size of the workforce. Separate forecasts are produced for leavers aged over and under 55 years old respectively, reflecting that the likelihood of teachers leaving service is driven by different factors for older and younger teachers. Separate forecasts are produced for primary and each individual secondary subject, reflecting differences in teacher retention levels between the teacher cohorts of different subjects.
Observations from the most recent years of school workforce census leaver rates data:
- In 2020/21, there was an unprecedented decrease in the number of teachers leaving the state-funded sector, with leaver rates falling to the lowest level observed since the school workforce census started in 2010. This fall was likely because of the impact of covid-19.
- In 2021/22, both primary and secondary leaver rates increased slightly but remained below their pre-pandemic levels. This was likely to be a result of the continuing effects of the covid-19 pandemic.
- In 2022/23, both primary and secondary leaver rates increased to be back in line with pre-pandemic levels. This was as expected given the economic effects of the pandemic subsided.
- In 2024/25, the latest year for which data was available [1] [2], leaver rates fell for most subjects (and primary) compared to 2023/24.
- Additionally, historical leaver rates have been retrospectively revised downward in the SWC last year. This related to a data issue within the Teacher Pension Scheme extracts that inflated leavers and returners for <1,000 teachers per year that has since been resolved by the publication team. Both these factors have resulted in lower, and therefore, more favourable, leaver rate trajectories in the TWM this year. A more favourable teacher retention outlook suggests that fewer teachers will leave service going forward than previously forecasted, and this has acted as a key driver of lower PGITT recruitment need this year compared to last.
When developing estimates of future leaver rates, the latest available economic forecasts from the OBR (as part of their Autumn Budget in November 2025) were accounted for, and any other known factors that might impact on future teacher numbers not yet reflected in the baseline (2024/25) data. Use of the OBR forecasts enabled the model to factor in an estimated effect of teacher pay growth relative to pay growth in the wider economy and the corresponding impact upon teacher retention.
The model also accounts for existing teachers that stay in service but reduce their working hours between years; this reduction in capacity is expressed in terms of FTE teachers that need to be replaced [3].
Estimating future entrant numbers, excluding PGITT
The TWM estimates the number of qualified entrants who will enter the workforce between 2024/25 and 2027/28. As with leaver numbers, future entrant numbers are forecast in the form of FTE (full time equivalent) rather than headcount, reflecting differences in working pattern between different types of inflow/outflow.
Both the number of returners (those teachers returning to the state-funded school sector in England) and those who are new to the sector (including newly trained teachers who do not join the workforce immediately after ITT) are estimated using forecasts that consider the latest workforce and economic data as of December 2025.
The model then estimates the number of teachers who will enter service having just gained qualified teacher status (QTS) via either the assessment only route or ITT using the latest ITT recruitment data. As some trainees will not complete ITT and immediately enter service after training, assumed ITT completion and post-ITT employment rates are applied to the numbers of trainees previously recruited to estimate the number of newly qualified entrants (NQEs).
Adjustment to counter under-supply from previous ITT rounds
One of the key drivers behind changes in 2026/27 PGITT trainee need for specific subjects is an adjustment included within the TWM to build in the estimated impact of recruitment being below PGITT trainee need in the two ITT rounds prior to 2026/27, as well as forecasted under-supply resulting from other routes into and out of teaching.
There are many factors that influence both the PGITT trainee need and under-supply adjustment, including (but not limited to): changes in teacher demand, supply forecasts for other routes into teaching, and both ITT completion and employment rates.
As well as considering the impact of PGITT/HPITT recruitment, DfE also consider the wider recruitment of teachers that are newly qualified via other routes such as undergraduate higher education institution (HEI) courses and assessment only (AO). Additionally, the TWM accounts for the recruitment of teachers that return having previously left the state-funded teaching sector (returners), and those that were already qualified but are new to the sector.
The model is holistic in the way it is influenced by both leaver rates and forecasted recruitment from other routes, and factors all these supply factors into the decision to make an under-supply adjustment (or not).
The process to assess whether to make an adjustment is shown below:
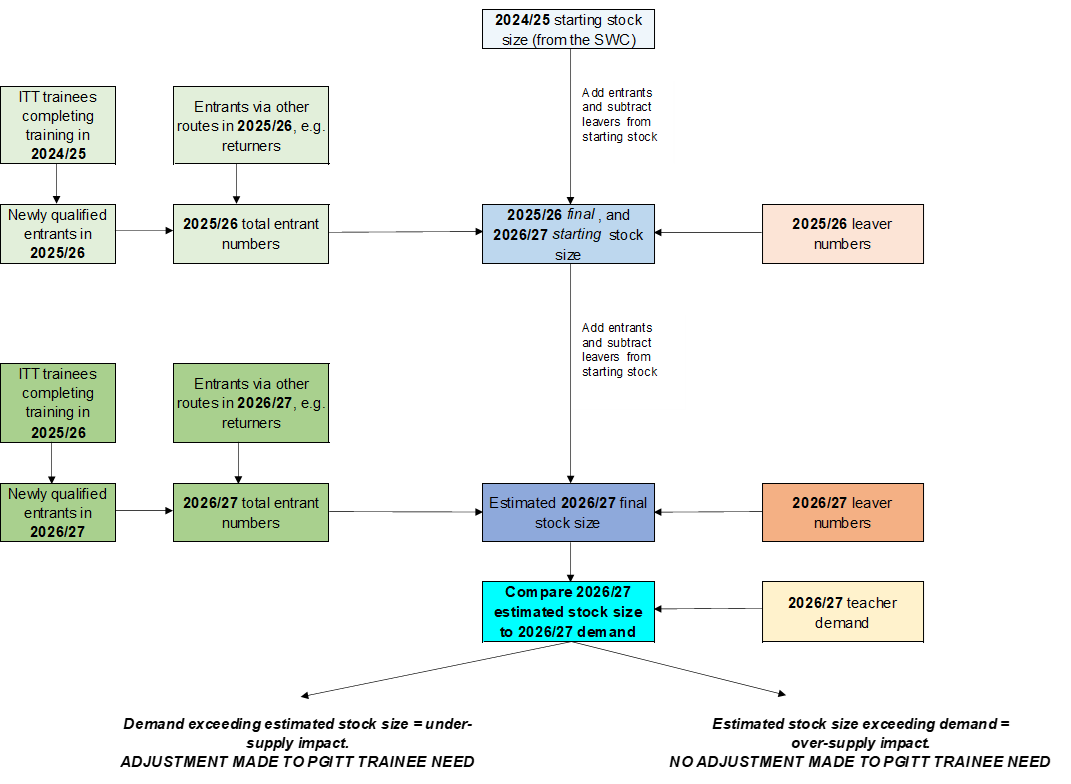
The TWM uses ITT recruitment data, and ITT completion and post-ITT employment rates to estimate the number of NQEs entering the workforce having trained via PGITT (both mainstream PGITT and high potential ITT routes) from the two ITT cycles immediately before 2026/27, for primary and each secondary subject.
The model uses these PGITT NQE figures for 2025/26 and 2026/27 respectively, along with estimates for both the corresponding numbers of entrants into the stock via other routes (e.g. returners) and leavers, to estimate the size of the workforce in 2026/27. This 2026/27 stock size is then compared to the previously estimated teacher demand for that year to identify whether we have recruited the teachers needed from the two PGITT rounds prior to 2026/27, also accounting for both teacher retention and wider recruitment.
If this comparison shows that we have under recruited in specific subjects, then an adjustment is applied by increasing the 2026/27 PGITT trainee need for those subjects. No adjustment is required for subjects where there is no under-supply impact. This action is taken as the recruitment impacts of the 2024/25 and 2025/26 PGITT cycles had not yet fed into the most recently published SWC from November 2024 which are used as baseline data by the model.
This year, the two ITT recruitment rounds that were relevant for developing 2026/27 PGITT trainee need were those for 2024/25 and 2025/26. Last year, the 2025/26 PGITT trainee need was developed by considering the workforce impacts resulting from the 2023/24 and 2024/25 ITT recruitment rounds.
As with last year, this adjustment has been a key driver of the subject level changes in PGITT trainee need this year:
- An increased adjustment this year was a key driver of the increased PGITT trainee need this year for Classics and Business Studies.
- Conversely, a smaller adjustment this year was a key driver of the lower PGITT trainee need this year for Mathematics, Physics, Computing, Modern Foreign Languages, Geography, Art and Design, Design and Technology, Drama, Music, Others, and Religious Education.
Footnotes:
[1] To note for modelling purposes, within the TWM it is assumed that those recorded in the SWC as ‘leavers’ in 2023/24 (the majority leaving service in the Summer of 2024) are leavers in 2024/25. This ensures that the cohort aligns within PGITT trainee need calculations to the 2023/24 entrants who will mostly be those hired to replace them in September 2024.
[2] School workforce in England, Reporting year 2024 - Explore education statistics - GOV.UK
[3] Some existing teachers that stay in service increase their working hours between years. However, the model estimates and accounts for the net impact of teachers changing their working hours between years, which is a reduction in FTE teacher numbers.
Contact us
If you have a specific enquiry about Teacher demand and postgraduate trainee need statistics and data:
Teacher Workforce Modelling team
Email: ittstatistics.publications@education.gov.ukContact name: Melissa Cook
Press office
If you have a media enquiry:
Telephone: 020 7783 8300
Public enquiries
If you have a general enquiry about the Department for Education (DfE) or education:
Phone: 0370 000 2288
Opening times
Monday to Friday from 9.30am to 5.30pm (closed on bank holidays)