Level 2 and 3 attainment age 16 to 25
Annual level 2 and 3 attainment figures age 16 to 25 in England. Includes qualification type, institution type, characteristics and geographical breakdowns.
Quick links
- Published
Background information
This release covers attainment at Level 2 (5 GCSEs 9-4 or equivalent) and Level 3 (2 A levels or equivalent) of young people at ages 16 to 25 in England. Attainment by age 19 is the focus of much of the commentary as this is the age most young people have achieved these levels and young people enter the labour market post formal education. This release differs from other post 16 attainment releases i.e. GCSE, A level as it follows the same young people across multiple ages, enabling users to see how young people build their attainment up to age 25.
Detail includes differences by characteristics, qualification types, institution types, local authority figures and a comparable time series back to 2004. Also included are figures on Level 2 attainment in English and maths up to age 19, allowing the impact of Condition of Funding changes for young people to be monitored, as introduced by the Education and Skills Funding Agency from 2014/15 onwards.
The cancellation of summer 2020 and 2021 exams and the new method of awarding grades has led to pupil attainment statistics that are unlike previous years. This is evident in our level 2 statistics at 16 and to a lesser degree, our level 3 statistics at 18. This increase in attainment at 16 will affect our statistics at age 19 in 2022/23 and 2023/24.
Headline facts and figures
Supplementary tables
In addition to the analysis presented in this release, a number of supplementary tables for easy reference are also available here:
- Table 1 - Headlines: Level 2 and 3 attainment by ages 16, 17, 18 and 19
- Table 2 - Level 2 by 19 by qualification type
- Table 3 - Level 3 by 19 by qualification type
- Table 4 - Level 2 by institution type (for achievements by ages 17-19)
- Table 5 - Level 3 by 19 by institution type
- Table 6 - Level 2 attainment in English and Maths (GCSEs only) by 19 by disadvantaged status and Special Educational Need (SEN)
- Table 7 - Level 3 attainment by 19 by disadvantage and Special Educational Need (SEN)
- Table 8 - Level 2, Level 3 and Level 2 in English and maths attainment by age 19 by local authority district and disadvantaged status
- Table 9 - Level 2, Level 2 in English and maths and Level 3 attainment by age 19 by local authority district and disadvantaged status
Explore the data further and build your own tables with our online table tool builder from the “Download data and files” section above.
Underlying data included in this release
Our underlying data files contain more data than are presented in the sections below. You can make your own tables online by clicking the ‘view data and files (opens in new tab)’ button at the top of this page. Alternatively, you can download the data as csv files using the same link. Here is a summary of what is included:
- Headlines (Level 2 and 3 attainment including English and maths and progression in English and maths).
- Level 2 and 3 attainment:
- File A. Ages 16-19.
- File B. Ages 16-25 (Figures for young people who turned 25 in the last 3 years to 2020-21).
- File C. Characteristics of those aged 16-19.
- File D. Local authority of those aged 16-19
- File E. Local authority district of those aged 16-19.
The letters underneath the data type show in which file you can find the data e.g. National figures are found in files A & B.
To note - the time period included in these files refers to the academic year the young person turned (or will turn) 19.
Level 2 | Age 16 | Age 17 | Age 18 | Age 19 | Progression from 16 to 19 | Ages 20-25 | |
National figures (A & B) | Headline figures | ✓ | ✓ | ✓ | ✓ | ✓ | ✓ |
| Qualification type | ✓ | ✓ | ✓ | ||||
| Institution type | ✓ | ||||||
State-funded figures (to enable characteristic breakdowns not available for those in independent schools) (C) | Headline figures | ✓ | ✓ | ✓ | ✓ | ||
| Gender | ✓ | ✓ | ✓ | ✓ | |||
| Disadvantaged status | ✓ | ✓ | ✓ | ✓ | |||
| FSM | ✓ | ✓ | ✓ | ✓ | |||
| IDACI (Income Deprivation Affecting Children Index) | ✓ | ✓ | ✓ | ✓ | |||
| SEN | ✓ | ✓ | ✓ | ✓ | |||
| Ethnicity | ✓ | ✓ | ✓ | ✓ | |||
| Ethnicity & FSM status | ✓ | ✓ | ✓ | ✓ | |||
| Ethnicity, FSM status & gender | ✓ | ✓ | ✓ | ✓ | |||
Local Authority (LA): State-funded (to enable geographic and characteristic breakdowns not available for those in independent schools) (D) | Local authority | ✓ | ✓ | ✓ | ✓ | ||
| Local authority & gender | ✓ | ✓ | ✓ | ✓ | |||
| Local authority & FSM status | ✓ | ✓ | ✓ | ✓ | |||
| Local authority & SEN | ✓ | ✓ | ✓ | ✓ | |||
Local Authority District (LAD): State-funded (to enable geographic and characteristic breakdowns not available for those in independent schools) (E) | Local authority district | ✓ | |||||
| Local authority district & disadvantaged status | ✓ | ||||||
| Local authority district & FSM status | ✓ | ||||||
Level 3 | Age 16 | Age 17 | Age 18 | Age 19 | Progression from 16 to 19 | Ages 20-25 | |
National figures (A & B) | Headline figures | ✓ | ✓ | ✓ | ✓ | ✓ | |
| Qualification type | ✓ | ||||||
| Institution type | ✓ | ||||||
State-funded figures (to enable characteristic breakdowns not available for those in independent schools) (C) | Headline figures | ✓ | ✓ | ✓ | |||
| Gender | ✓ | ✓ | ✓ | ||||
| Disadvantaged status | ✓ | ✓ | ✓ | ||||
| FSM | ✓ | ✓ | ✓ | ||||
| IDACI (Income Deprivation Affecting Children Index) | ✓ | ✓ | ✓ | ||||
| SEN | ✓ | ✓ | ✓ | ||||
| Ethnicity | ✓ | ✓ | ✓ | ||||
| Ethnicity & FSM status | ✓ | ✓ | ✓ | ||||
| Ethnicity, FSM status & gender | ✓ | ✓ | ✓ | ||||
Local Authority: State-funded (to enable geographic and characteristic breakdowns not available for those in independent schools) (D) | Local authority | ✓ | ✓ | ✓ | |||
| Local authority and gender | ✓ | ✓ | ✓ | ||||
| Local authority & FSM status | ✓ | ✓ | ✓ | ||||
| Local authority & SEN | ✓ | ✓ | ✓ | ||||
Local Authority District: State-funded (to enable geographic and characteristic breakdowns not available for those in independent schools) (E) | Local authority district | ✓ | |||||
| Local authority district & disadvantaged status | ✓ | ||||||
| Local authority district & FSM status | ✓ | ||||||
| Local authority district & qualification type | ✓ | ||||||
Level 2 English & maths | Age 16 | Age 17 | Age 18 | Age 19 | Progression from 16 to 19 | Ages 20-25 | |
State-funded figures (to enable characteristic breakdowns not available for those in independent schools) (C) | Headline figures | ✓ | ✓ | ✓ | ✓ | ✓ | |
| Gender | ✓ | ✓ | ✓ | ✓ | ✓ | ||
| Disadvantaged status | ✓ | ✓ | ✓ | ✓ | ✓ | ||
| FSM | ✓ | ✓ | ✓ | ✓ | ✓ | ||
| IDACI (Income Deprivation Affecting Children Index) | ✓ | ✓ | ✓ | ✓ | ✓ | ||
| SEN | ✓ | ✓ | ✓ | ✓ | ✓ | ||
| Ethnicity | ✓ | ✓ | ✓ | ✓ | ✓ | ||
| Ethnicity & FSM status | ✓ | ✓ | ✓ | ✓ | ✓ | ||
| Ethnicity, FSM status & gender | ✓ | ✓ | ✓ | ✓ | ✓ | ||
Local Authority: State-funded (to enable geographic and characteristic breakdowns not available for those in independent schools) (D) | Local authority | ✓ | ✓ | ||||
| Local authority and gender | ✓ | ✓ | |||||
| Local authority & FSM status | ✓ | ✓ | |||||
| Local authority & SEN | ✓ | ✓ | |||||
Local Authority District: State-funded (to enable geographic and characteristic breakdowns not available for those in independent schools) (E) | Local authority district | ✓ | ✓ | ✓ | |||
| Local authority district & disadvantaged status | ✓ | ✓ | ✓ | ||||
| Local authority district & FSM status | ✓ | ✓ | ✓ | ||||
About this publication
Given the circumstances in which grades were awarded in 2020 and 2021 and the delays to examinations due to the Covid-19 pandemic, caution should be taken in comparing 19/20 and 20/21 data to previous years
These National Statistics provide information at both national, local authority and local authority district level on the attainment of 19-year olds at the end of each academic year (e.g. 2020/21 refers to 31 August 2021). They are used to monitor trends in attainment over time and changes in attainment within different groups.
The figures are based on a matched administrative dataset produced by the Department for Education consisting of data from the Individualised Learner Record (ILR), key stage 4 and 5 awarding body results and the School Census.
The statistics are based on two cohorts as follows:
• An overall national cohort has a numerator based on all young people captured in the dataset (not just those in the state-sector in year 11), and has a denominator based on the whole school population (including state-funded maintained schools, independent schools, Alternative Provision (APs) and Pupil Referral Units (PRUs)), as recorded at academic age 14 i.e. year 10, or the penultimate year of secondary school.
• The state-funded cohort is based on pupils recorded in mainstream state-funded schools at academic age 15 i.e. year 11 or the final year of secondary school (the state-funded cohort also includes a small number of learners who attended non-maintained special schools). The state funded cohort includes breakdowns by various pupil characteristics (as recorded at academic age 15).
There are differences in the methodology in the attainment measures for the national and state-funded cohorts, which mean that they should not be directly compared.
In these statistics, the attainment of the following measures refers to the proportion of people who achieved them as at 31st August i.e. the end of the academic year (e.g. 2020/21 refers to 31st August 2021):
• Level 2 is 5 (or more) GCSEs at grades 9-4/A*-C or equivalent e.g. Level 2 vocational qualification
• Level 3 is 2 (or more) A levels or equivalent e.g. Level 3 vocational qualification
• Level 2 in English and maths is GCSEs at grades 9-4/A*-C in those subjects or equivalent qualifications.
• Progression in English and maths is those people who did not achieve level 2 in English and/or maths at 16 but had achieved both at 19.
For further background information on these statistics, including on the data sources, qualifications and the methodology, please see the accompanying methodology. Underlying data is also published alongside this release.
Feedback
We would welcome feedback on any aspect of this publication at: Post16.STATISTICS@education.gov.uk
Impact of COVID-19 on our data series
Due to the COVID-19 pandemic, the summer exam series for the 2019/20 and 2020/21 academic years were cancelled (opens in new tab).
Instead, for 2020/21, pupils were only assessed on the content they had been taught for each course. Schools were given flexibility to decide how to assess their pupils’ performance, for example, through mock exams, class tests, and non-exam assessment already completed. GCSE grades were then determined by teachers based on the range of evidence available and they are referred to as teacher-assessed grades.
This is a different process to that of 2019/20 when pupils were awarded either a centre assessment grade (based on what the school or college believed the pupil would most likely have achieved had exams gone ahead) or their calculated grade using a model developed by Ofqual - whichever was the higher of the two.
For other non-academic qualifications, awarding organisations were permitted to adapt qualifications and assessments, or to issue results using alternative arrangements, for example, based on teacher-assessed grades. The results from the Autumn resits are included in this release.
The cancellation of summer 2020 and 2021 exams and the new method of awarding grades has led to a set of pupil attainment statistics that are unlike previous years. This is evident in our level 2 statistics at 16 and to a lesser degree, our level 3 statistics at 18.
The figures below focus on those aged 16 in 2021, the majority of which received teacher assessed grades.
Most young people achieve Level 2 at age 16 therefore our Level 2 by 19 figures in recent years do not yet reflect the increase seen in the proportion achieving Level 2 as a result of calculated/teacher assessed grades. We have to wait until the affected cohorts are 19 to see the true effect of the exam cancellations.
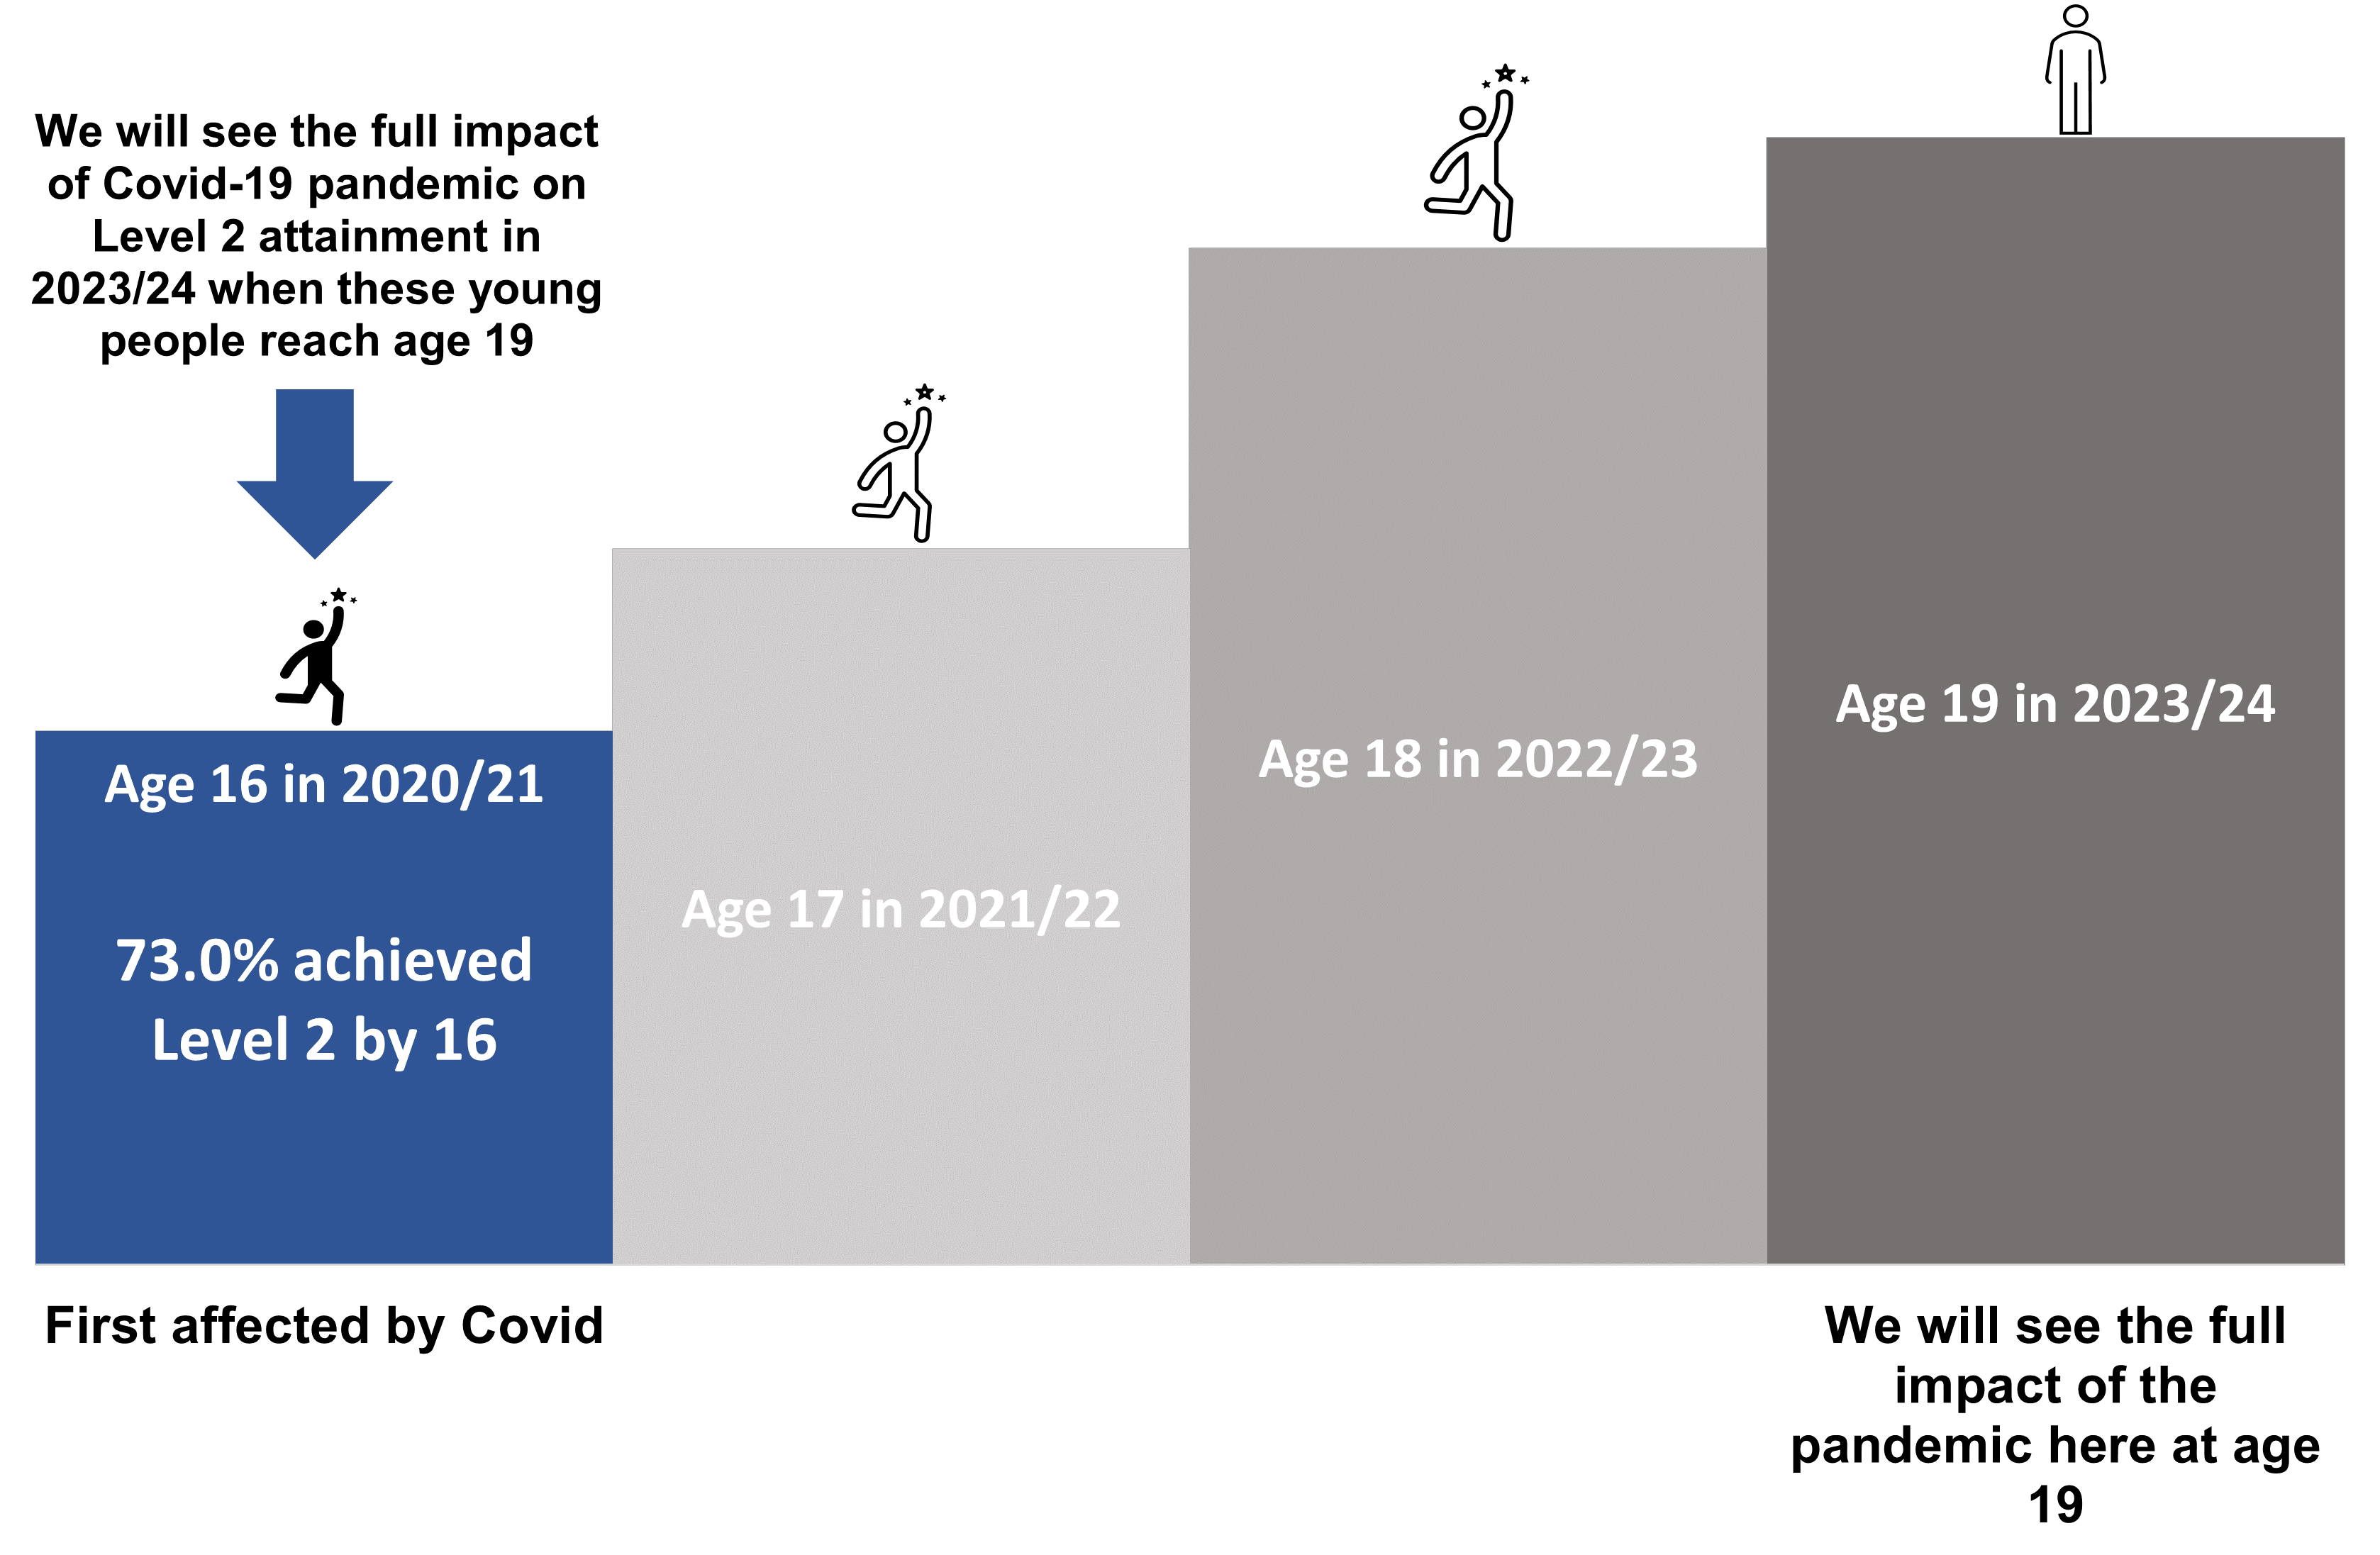
Those 16 in 2020/21 are the second cohort affected by the Covid-19 exam cancellations.
Level 2 attainment at 16 by pupil characteristics
- Level 2 attainment at age 16 in 2020/21 is the highest on record at 73.0%, up 0.4 percentage points since 2019/20 and up 9.1 percentage points since 2018/19 (pre Covid-19).
- Level 2 attainment at age 16 has remained stable across all characteristics, maintaining the increases from calculated and teacher assessed grades.
- As shown in figure 1, disadvantage, deprivation and gender attainment gaps have fallen following the changes to exam grading due to Covid-19 after being relatively stable since 2013/14. The SEN and FSM attainment gaps have remained stable.
- There is no evidence that the grades awarded this year were systematically biased against candidates with protected characteristics or from disadvantaged backgrounds.
Additional analysis on impact of COVID-19: Level 2 attainment at 16 by ethnicity
Figure 2 shows, that at age 16, the black ethnic group as a whole had the lowest attainment at level 2 before Covid-19. However, this group has seen the largest percentage point increase since, which has brought the black ethnic group in line with the average attainment level.
The Chinese ethnic group saw the lowest percentage point increase compared to pre Covid-19. However, the Chinese ethnic group have consistently been the highest attaining group and so while attainment has increased for this group, there is less room for improvement.
Headlines
Data in this section is based on the whole school population (including state-funded maintained schools, independent schools, Alternative Provision (APs) and Pupil Referral Units (PRUs)) as recorded at academic age 14.
Given the circumstances in which grades were awarded in 2020 and 2021 due to the Covid-19 pandemic, caution should be taken in comparing 19/20 and 20/21 data to previous years
Level 2 attainment by 19
As shown in table 1:
- In 2020/21, 82.9% of 19 year olds were qualified to Level 2, relatively stable compared with the previous year.
- There have been consecutive annual falls in Level 2 attainment by 19 since 2014/15. Prior to then, Level 2 attainment by 19 rose every year.
- Despite the recent falls, Level 2 attainment by 19 has increased by 17 percentage points compared with 2003/04.
Level 2 by 19 by qualification type
Some vocational Level 2 qualifications no longer count in Key stage 4 performance measures following reforms introduced further to Professor Alison Wolf’s review (opens in new tab). This has significantly reduced the offering and take-up of these larger vocational qualifications at Key stage 4 and primarily affects lower attaining students studying ‘equivalent’ qualifications.
Figure 3 shows that since 2014/15, when these changes came into effect, attainment of Level 2 by vocational qualifications at 16 has led to a decrease in overall Level 2 attainment by 19.
However, the fall in proportion achieving Level 2 at 16 through vocational qualifications, has been partially offset by an increase in GCSEs. It is probable that some of the pupils who would otherwise have achieved Level 2 via vocational qualifications are instead achieving Level 2 via GCSEs.
Level 3 attainment by 19
As shown table 2, the proportion of 19 year olds in 2020/21 who had achieved Level 3 is the highest on record at 62.2%. The increase of 1.8ppts this year is likely due to the changes to examinations caused by the Covid-19 pandemic.
Level 3 attainment by 19 by qualification type
In 2020/21, the 1.8ppt increase in Level 3 attainment has been driven mainly by an increase in vocational qualifications, continuing a long term trend.
Pupil characteristics
This section reports on the attainment of 19-year olds who were recorded in the mainstream state sector in year 11 (i.e. the final year of secondary school) and their associated characteristics at that time.
The proportion achieving Level 2 and 3 overall in this section differs to the headlines as it does not include those in independent schools, meaning they should not be directly compared – see coverage section in the Methodology for further details.
Given the circumstances in which grades were awarded in 2020 and 2021 due to the Covid-19 pandemic, caution should be taken in comparing 19/20 and 20/21 data to previous years
Level 2 attainment by 19 by pupil characteristics
Looking at Level 2 attainment by 19 by pupil characteristics (as recorded in year 11), as shown in figure 5:
- Attainment across all characteristics has remained stable in 2020/21.
- The attainment gap between males and females has increased (with females having higher attainment), while attainment gaps for all other characteristics have narrowed or stayed the same.
- Attainment gaps increased following reforms to qualifications after Professor Alison Wolf’s review (opens in new tab).
Level 2 attainment by 19 by ethnicity
There are notable differences in Level 2 attainment by 19 by ethnicity. Attainment has consistently been the highest for the Chinese ethnic group throughout the decade and consistently been the lowest for white ethnicities as shown in figure 6.
In the latest year:
- Level 2 attainment by 19 increased or stayed the same for all ethnicities in 2020/21.
- All groups apart from the Chinese ethnic group have fallen compared to a decade earlier.
- All ethnicities peaked in 2013/14 or 2014/15, and have experienced falls since, apart from the Chinese ethnic group, who have had consecutive annual rises for the last 4 years.
- The black ethnic group as a whole have the lowest attainment at 16 but overtake the mixed ethnic group and white ethnicities by age 19.
Level 2 attainment by 19 by FSM status, ethnicity and gender
From figure 7:
- The difference in attainment (i.e. attainment gap) between FSM eligible/not eligible are largest for the white ethnic group and lowest for the Chinese ethnic group.
- For boys, attainment gaps between FSM eligible/not eligible are largest for white boys at 29 percentage points and lowest for Chinese boys at 10 percentage points.
- For girls, attainment gaps between FSM eligible/not eligible are largest for white girls at 25 percentage points and lowest for Chinese girls at 3 percentage points.
Level 3 attainment by 19 by pupil characteristics
Looking at Level 3 attainment by 19 by pupil characteristics (as recorded in year 11)
- Attainment across all characteristics has increased in 2020/21. (as shown in the table supporting figure 8)
- Attainment gaps have narrowed for all characteristics following the exam cancellations caused by Covid-19 apart from gender which has increased slightly. (as shown in figure 8)
Level 3 attainment by 19 by ethnicity
There are notable differences in level 3 attainment by 19 by ethnicity. Attainment has consistently been the highest for the Chinese ethnic group throughout the decade and consistently been the lowest for the white ethnic group as shown in figure 9 below.
In the latest year:
- Attainment was the highest on record for all ethnicities in 2020/21.
- All ethnicities have had overall increases compared with 10 years earlier, with the black ethnic group having experienced the largest rise.
English and maths
This section reports on the attainment of 19-year olds who were recorded in the mainstream state sector in year 11 (i.e. the final year of secondary school) and their associated characteristics at that time.
The proportion achieving Level 2 and 3 overall in this section differs to the headlines as it does not include those in independent schools, meaning they should not be directly compared – see coverage section in the Methodology for further details.
Given the circumstances in which grades were awarded in 2020 and 2021 due to the Covid-19 pandemic, caution should be taken in comparing 19/20 and 20/21 data to previous years
Level 2 in English and maths
The progression in Level 2 English and maths measure shows the proportion of students who had not achieved Level 2 in English and/or maths at 16 but had achieved both at 19.
These figures allow us to measure the impact of Condition of Funding changes from 2014/15 onwards. Following these changes, most students continue to study English and/or maths at level 2 as part of their programmes between the ages of 16 and 19 if they are yet to achieve qualifications at this level. The exact qualifications that students are required to do depends on their personal circumstances. Further information is listed on 16 to 19 funding: maths and English condition of funding - GOV.UK (www.gov.uk) (opens in new tab)
- Level 2 attainment of English and maths by age 19 is the highest on record in 2020/21 at 73.0%.
- Progression is the highest on record for maths alone, English alone and English and maths combined (see figure 10).
- Attainment of Level 2 English and maths at age 16 has remained stable over the last 4 years, meaning that the increases post 16 are positive i.e. not a result of falls before the age of 16.
- At age 16, attainment in maths is higher than attainment in English. By age 19 this has reversed.
- Despite the improvements made, it means that in 2020/21 at least two-thirds of those who did not have Level 2 English and/or maths at 16 still had not achieved one or both qualifications at 19.
With the exception of last year, progression in Level 2 English and maths has been rising each year since it became mandatory in 2014/15 for those who had not achieved to continue to study these subjects.
Figure 11 shows the attainment of Level 2 in English and maths by age 16 and post-16 up to age 19.
- Less young people from disadvantaged or lower income backgrounds achieve Level 2 in English and maths than those not disadvantaged.
- At age 16, males, those with special educational needs (SEN), those from low income backgrounds and the disadvantaged have lower attainment, with a greater proportion achieving level 2 post-16 than their counterparts.
Level 2 and 3 attainment up to age 25
Data in this section is based on the whole school population (including state-funded maintained schools, independent schools, Alternative Provision (APs) and Pupil Referral Units (PRUs)) as recorded at academic age 14.
Level 2 attainment by age 25
- As figure 13 shows, most young people achieve Level 2 by age 19.
- Achievements are ongoing past the age of 19 however, with 90.5% achieving Level 2 by age 25, 3.0% more than at age 19.
Level 3 attainment by age 25
- As figure 14 shows, most young people achieve Level 3 by age 19.
- Achievements are ongoing past the age of 19, with 67.1% achieving Level 3 by age 25.
- The uplift post-19 is greater at Level 3 than at level 2 with 6.6% achieving after age 19.
Contact us
If you have a specific enquiry about Level 2 and 3 attainment age 16 to 25 statistics and data:
Post-16 statistics team
Email: post16.statistics@education.gov.ukContact name: Elisha Duddle
Telephone: 0161 600 1497
Press office
If you have a media enquiry:
Telephone: 020 7783 8300
Public enquiries
If you have a general enquiry about the Department for Education (DfE) or education:
Phone: 0370 000 2288
Opening times
Monday to Friday from 9.30am to 5.30pm (closed on bank holidays)