Apprenticeships and traineeships
Apprenticeship and traineeship starts, achievements and participation. Includes breakdowns by age, sex, ethnicity, subject, provider, geography etc.
Quick links
- Published
- Last updated
Background information
November 2023 release
This release shows full-year data on apprenticeships and traineeships in England for the 2022/23 academic year covering the period August 2022 to July 2023 (based on data returned by providers in October 2023).
This update also includes the latest available apprenticeship service data (as of 30 October 2023) and Find an apprenticeship data (to October 2023).
Changes to the structure of the release
In January we changed the structure of the release to improve user access to content and to allow for easier maintenance. The same amount of data is still being published on a quarterly basis. If you wish to provide feedback on these changes please contact us at FE.OFFICIALSTATISTICS@education.gov.uk.
As announced in November 2022 we are changing the content of the monthly updates in between the quarterly updates. Specifically, this includes February, April, May, June, August, September and October.
All other data previously published monthly, such as that covering the apprenticeship service and find an apprenticeship, will be updated in the quarterly releases (January, March, July, and November).
Impact of COVID-19 on reporting of FE and apprenticeship data
Historic data in this release covers periods affected by varying COVID-19 restrictions, which impacted on apprenticeship and traineeship learning and also provider reporting behaviour via the Individualised Learner Record. Therefore, extra care should be taken in comparing and interpreting data presented in this release.
Please note that the ‘Explore data and files used in this release’ section contains the underlying files that underpin this release and allows expert users to interrogate and analyse the data for themselves. For pre-populated summary statistics please see the relevant section underneath, from which the data can be further explored using the ‘Explore data’ functionality. You can also view featured tables or create your own table using the ‘create your own tables' functionality.
Headline facts and figures
Starts (Aug - Jul)
337,140
down by 3.5% from 2021/22
What is this?
All-age (16+) apprenticeship starts in England for the 2022/23 academic year.
Participation (Aug - Jul)
752,150
up by 1.6% from 2021/22
What is this?
All-age (16+) apprenticeship participation in England for the 2022/23 academic year.
Achievements (Aug - Jul)
162,320
up by 18.3% from 2021/22
What is this?
All-age (16+) apprenticeship achievements in England for the 2022/23 academic year.
Figures for the 2022/23 academic year show:
- Apprenticeship starts were down by 3.5% to 337,140 compared to 349,190 reported for 2021/22.
- Under 19s accounted for 23.1% of starts (77,720).
- Advanced apprenticeships accounted for 43.9% of starts (147,930) whilst higher apprenticeships accounted for a 33.5% of starts (112,930).
- Higher apprenticeships continue to grow in 2022/23. Higher apprenticeship starts increased by 6.2% to 112,930 compared to 106,360 in 2021/22.
- Starts at Level 6 and 7 increased by 8.2% to 46,800 in 2022/23. This represents 13.9% of all starts for 2022/23. There were 43,240 Level 6 and 7 starts in 2021/22 (12.4% of starts).
- Starts supported by Apprenticeship Service Account (ASA) levy funds accounted for 68.1% (229,720).
- Since May 2015 there have been 3,218,990 apprenticeship starts. Since May 2010 this total stands at 5,596,530.
- Apprenticeship achievements increased by 18.3% to 162,320 compared to 137,220 in 2021/22. Please note: COVID-19 restrictions and assessment flexibilities affected the timing of achievements, therefore care must be taken when comparing achievements between years as some achievements expected in a given academic year may have been delayed to the subsequent year.
- Learner participation increased by 1.6% to 752,150 compared to 740,350 in 2021/22.
About these statistics
This statistical release presents information on all age (16+) apprenticeships starts, achievements and participation in England for the 2022/23 academic year.
Also published are official statistics covering:
- Apprenticeship service commitments
- Employers reporting the withdrawal of apprentices due to redundancy
- Adverts and vacancies as reported on the Find an apprenticeship (opens in new tab) website
A separate release covers overall further education and skills data, please see ‘Further education and skills’. Please note that the FE and skills release includes the adult apprenticeships and traineeships published here in its headline figures.
Individualised Learner Record (ILR) administrative data
The apprenticeship data in this release published in November 2023 are based on the final ILR data return from FE and apprenticeship providers for the 2022/23 academic year, which was taken in October 2023. The ILR is an administrative data collection system designed primarily for operational use in order to fund training providers for learners in FE and on apprenticeship programmes.
National achievement rate tables data
Figures in the ‘national achievement rate tables’ section are as published in March 2023. These official statistics cover achievement rates for apprenticeships in the 2021/22 academic year and would have been previously released as part of the standalone National achievement rate tables publication (opens in new tab).
Provider reporting during the COVID-19 pandemic
Historic data in this publication covers periods affected by varying COVID-19 restrictions, which will have impacted on apprenticeship and traineeship learning. Therefore, extra care should be taken in comparing and interpreting data presented in this release.
The furlough scheme may also have impacted on how aspects of ILR data were recorded, such as how the ‘learning status’ of a learner was captured, e.g. whether a learner was recorded as a continuing learner or whether they were recorded as being on a break in learning while still being with an employer.
How to find data and supplementary tables in this release
The Apprenticeships and traineeships publication still provides the same range of data it always did, but for this academic year we have made structural changes to improve user’s experience.
We have also adopted a new naming convention for files to help users find their data of interest. We have not changed the content of these files except in a few cases where we have merged some smaller files. You can find a look-up of the old and new file names in the file called “New Release Layout - Names Lookup” that can be found in the ‘Additional supporting files’ accordion.
This section serves to signpost users to the data most relevant to their uses by detailing the routes through which it can be accessed.
The content of the publication below contains charts and tables which highlight key figures and trends that give an overview of the national picture of the apprenticeship and traineeship landscape.
'Featured tables' provide further detail with figures broken down by common areas of interest. These can be found by going to the 'Explore data and files used in this release' section and clicking 'View or create your own tables'. Featured tables are shown in ‘Select a data set or featured table’ (Step 2). These tables are created to provide the next level of detail one might wish to find below the level of detail provided by tables embedded within the release. They also provide the user the opportunity to then amend content, reorder and take away to meet their needs. Within the release we list out the most relevant featured tables at the end of each commentary section.
In addition to featured tables you can also access underlying data files and build your own tables using the ‘Create your own tables’ tool. For example, the featured table showing enrolments by provider is produced from an underlying data file which also contains detail on the level of an aim, and it's sector subject area.
The list of files available can be accessed in the 'Explore data and files used in this release' section and clicking 'View or create your own tables'. In ‘Select a data set or featured table’ (Step 2) the file (‘data set’) of interest can be selected.
Alternatively you can modify an existing featured table by selecting it and then depending on the breakdowns available, edit the location, time period, indicators and/or filters (Steps 3, 4 and 5).
There is a dashboard that provides interactive presentation of our published data, with a number of different views on to data and ‘drilldown’ capability to allow users to investigate different types of FE provision. It is particularly helpful in viewing data across different geographical areas and providers. See the View related dashboard(s) accordion for the dashboard link.
This release also contains an ‘Additional supporting files’ accordion containing mainly csv files that can be downloaded, which provide some additional breakdowns including unrounded data. They are provided for transparency to enable analysts to re-use the data in this release. A metadata document is available in the same location which explains the content of these supporting files.
All of the data available in this release can be downloaded using the 'Download all data (zip)' button at the top right of this page. The 'Explore data and files used in this release' section also has the functionality to download all files, but also contains a data catalogue that allows individual files to be downloaded.
Feedback
We have made recent structural changes to how we publish our data and statistics. We continually look to improve our data and statistics and your feedback is important to help us further improve and develop. To provide feedback on this release, please email us at FE.OFFICIALSTATISTICS@education.gov.uk.
Full year Apprenticeships data
The figures in this section relate to full-year final data up to and including the 2022/23 academic year and were first published in November 2023
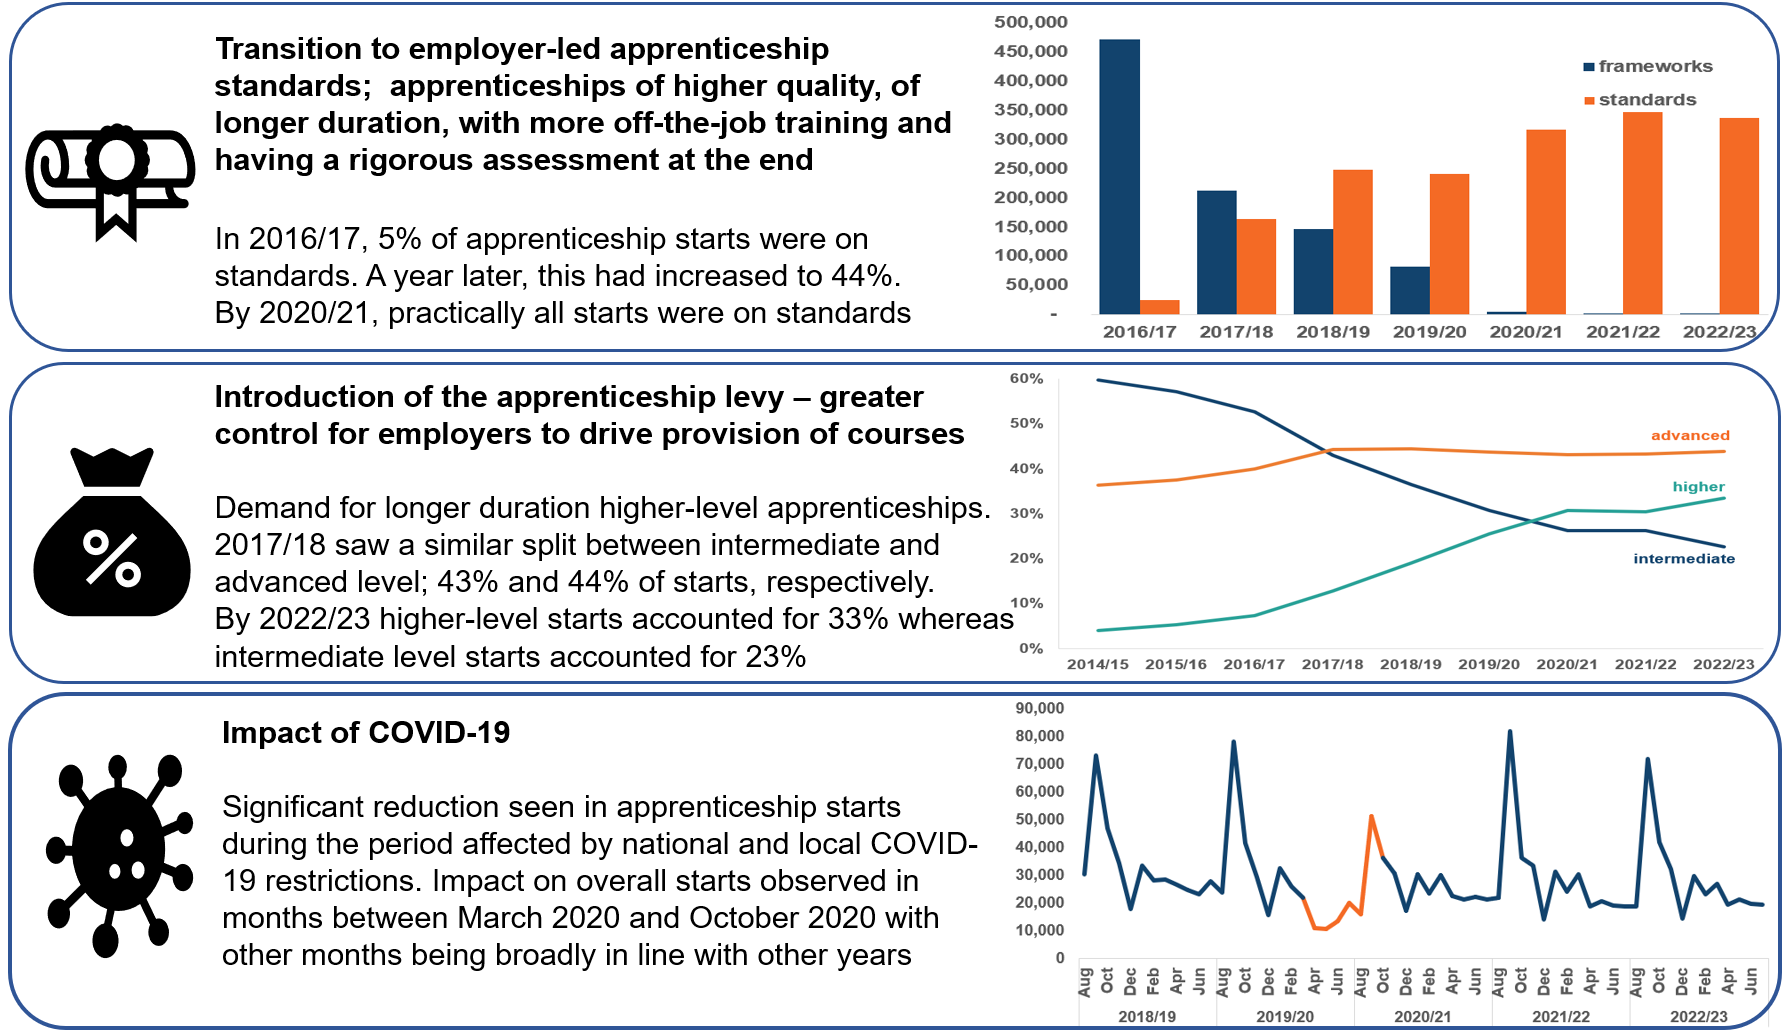
The changing apprenticeship landscape
Reform of the apprenticeships programme, along with the impact of the COVID-19 pandemic have influenced the trends presented in this section. Three main factors are set out in the graphic below.
History of apprenticeship participation
Adult participation
Participation in apprenticeships by those aged 19+ in 2022/23 was 621,000 – an increase of 1.2% on the 2021/22 figure of 613,900.
Putting those figures into context, the total number of adults participating in all further education and skills was just over 1.8 million in 2022/23.
All age apprenticeship participation by level
There was a steady decline in total participation between 2016/17 and 2020/21 with learner numbers falling by over a fifth from 908,700 to 713,000.
Apprenticeship starts declined at a faster rate than seen for participation during the same period, falling by a third. The transition to apprenticeship standards, the decline in shorter intermediate apprenticeships and the growth in longer apprenticeships at level 4 and above help explain this difference.
Since 2020/21, participation has risen in each year with 752,200 learners recorded in 2022/23 – 5.5% higher than in 2020/21. The continued increase in participation at higher levels has more than offset the decline at intermediate level during this time. Participation in intermediate apprenticeships fell by 23,600 (12.8%) between 2020/21 and 2022/23, but higher apprenticeship participation increased by 53,400 (25.7%).
Subject, Level and Age
Final figures reported to the end of 2022/23 show:
- The 337,140 starts reported for the 2022/23 academic year are 3.5% lower than the 349,190 reported for 2021/22, and 4.9% higher than the 321,440 reported for 2020/21. Starts are 14.3% lower than seen in 2018/19.
- Steady growth in higher level apprenticeships with starts at their highest volume and nearly six times higher than in 2014/15. A third of all starts (33.5%) were at Level 4 and above compared to 4.0% in 2014/15.
- Starts in degree-level apprenticeships (level 6 and 7) have grown to 46,800 – representing 13.9% of all starts in 2022/23.
- Starts at level 6 and 7 grew by 8.2% from 43,240 the previous year and were over four-times greater than in 2017/18, where they represented only 2.9% of all starts.
- The share of starts for Under 19s was 23.1% compared to 29.3% for 19-24 year olds and 47.6% for those aged 25+.
- The fall in apprenticeship starts compared to 2021/22 can be attributed to adults. Starts for under 19s increased marginally by 0.3%, while those by 19-24 year-olds saw a 7.1% decline, and starts for those aged 25 and over fell by 2.9%. This is the second consecutive year that has seen the share of starts by under 19s increase – improving from a low of 20.3% in 2020/21. Prior to 2021/22, starts by under 19s had seen the steepest decline – reducing by about half since 2015/16 compared to 38.5% for 19-24s and 27.8% for 25+. 2017/18 saw the largest single-year decline in starts for an age-group.
- Science, technology engineering and maths (STEM) subjects accounted for 28.5% of starts – a marginal increase from 28.2% in the previous year. 2020/21 saw a disproportionately large drop in starts for STEM subjects – falling by 15.4% compared to 2019/20 while non-STEM grew by 5.7%.
- Health, public services and care remains the most popular tier 1 subject area (29.3% of starts), ahead of Business, Administration and Law (26.9%). Both these subject areas have seen a decline in overall share of starts since 2020/21 but the reduction in Business has been larger.
- Information and Communications Technology (ICT) is the only tier 1 subject area to see an increase in starts compared to 2021/22. ICT has shown a 10% growth in starts in the last year and has increased steadily to make up 7.4% of all starts in 2022/23.
Apprenticeship achievements
The 162,320 achievements reported for the 2022/23 academic year represent the highest number since 2018/19. Achievements are 18.3% up on the 137,220 reported for 2021/22 although remain 12.3% lower than the 185,150 reported in 2018/19.
Levy
Total starts supported by ASA levy funds were 229,720; this accounts for over two-thirds (68.1%) of all starts. Please see the Further education and skills statistics: methodology for more information about ASA levy funds.
Length of employment
The large majority of apprenticeship starts are either by new employees with up to 3 months service or established employees who have been employed for more than 12 months. In 2014/15 there was a relatively even split between these groups (around 41% of starts in each). The trend has shifted to proportionally more newer employees starting apprenticeships. In 2022/23, apprentices employed for up to 3 months accounted for 46.3% of starts where length of employment was known, compared to 37.3% who had been employed for more than a year.
Expected Duration
The expected duration of an apprenticeship is the difference between the associated start date and planned end date as recorded in the ILR.
Final figures show that the average expected duration of an apprenticeship:
- increased from 406 days in 2011/12 to 628 days in 2022/23
- increased by 0.8% in the last year - from 623 days in 2021/22
- is significantly higher for level 6 and 7 apprenticeships. The increased uptake at these levels will have contributed to the overall increase in planned duration
Ethnicity
Starts by learners from ethnic minorities (excluding white minorities) as a proportion of all starts have increased year-on-year to 15.4% in 2022/23.
Since 2017/18, the growth of Asian/Asian British learners has outpaced other ethnic minorities (excluding white minorities) with a 33.0% increase in starts compared to 19.9% for mixed/multiple ethnic groups and 9% for Black learners.
Sex
Females accounted for 51.2% of starts in 2022/23. This share has fluctuated in recent years with a high of 53.4% in 2020/21, preceded by a low of 48.8% in 2019/20.
Learning Difficulties
Apprentices declaring a learning difficulty or disability accounted for 15.3% of starts in 2022/23. This proportion has risen steadily from 10.1% in 2015/16.
Region
Starts in all regions have fallen compared to 2021/22, ranging from a 6.3% decrease in the North East, to a 2.3% drop in the West Midlands. Accounting for population size in each region, London has the lowest rates of starts, participation and achievements. The North East, Yorkshire and the Humber and the South West have the highest rates for these measures.
Apprenticeship starts, participation and achievement rates per population are also available at local authority district (LAD) level available via the ‘Explore data’ button in the map above. In these statistics, rates for Richmondshire are significantly higher than in other areas. This is due to the location of Catterick Garrison within its boundary and the high prevalence of apprenticeships in the British Army.
Provider Type
Private sector, public funded providers were responsible for around two-thirds of starts (65.5%) in 2022/23. This is slightly higher than the share of starts in these providers in 2018/19 (63.3%). Over the same period the share of starts in general FE colleges fell from 23.7% in 2018/19 to 17.4% in 2022/23.
Flexi Job Apprenticeship Agencies
Flexi-job apprenticeship agencies are a new initiative developed by the Department for Education (DfE) in 2021. They are organisations that recruit and employ apprentices and arrange placements with multiple host businesses for the duration of their apprenticeship. They aim to support sectors and occupations that often use short-term contracts or other non-standard employment models, such as construction, digital, and creative industries. They also help employers and apprentices overcome barriers that prevent them from using the traditional apprenticeship model, such as lack of flexibility, commitment, or funding. Flexi-job apprenticeship agencies provide a managed apprenticeship service that benefits both employers and apprentices.
Employers and apprentices can use an approved flexi-job apprenticeship agency where the agency:
- employs the apprentice for the duration of their apprenticeship
- arranges placements with host businesses
Within the Flexi Job Apprenticeship Agency programme there have been 120 apprentices starts in 2021/22; growing to 640 apprentices starts in 2022/23.
Note: Learners are counted on the Flexi Job Apprenticeship Agency programme based upon the following methodology.
A specific code identifies Flexi Job Apprenticeship Agencies (FJAA) when an employer creates a commitment for this on the apprenticeship service. This is then associated with an apprentice in the ILR by joining up the apprenticeship unique id. FJAAs are a specific, and discrete published short list of employers (opens in new tab).
Providers when entering apprenticeship learner details into the ILR can be counted using the LDM code 386 to signify FJAA volumes. In reality, it is possible that there can be a lag between a provider capturing apprenticeship starts and an FJAA employer entering a commitment on the system. Hence, FJAA volumes are based upon both FJAA employers logging commitments and /or providers servicing designated FJAA employer apprentices.
Additional featured tables
The following featured tables offer more detailed breakdowns and combinations of characteristics and are available in our create your own tables tool:
Headline full year comparisons - starts by age
Headline full year comparisons - starts by age and level
Headline full year comparisons - starts by level
Headline full year comparisons - achievements by level
Geographical - starts and achievements by region
Geographical - starts by English Devolved Area by level
Geographical - starts since 2010 by parliamentary constituency
Geographical - starts, achievements and participation by level and parliamentary constituencies
Learner characteristics - participation by IMD quintile and age
Learner characteristics - starts by age group, LLDD and ethnicity
Learner characteristics - starts by age and IMD quintile
Learner characteristics - Starts, Participation, Achievements by detailed learning difficulty/learner disability
Provider starts and achievements
Subjects - Achievements in year comparisons
Subjects - showing starts split between frameworks and standards by level
Subjects - Starts by STEM, Sector Subject, and Sex
Subjects - Starts showing individual frameworks and standards
Starts by funding type, level and age
Full year Traineeships data
On the 31 July 2023 the standalone traineeship programme came to an end. Traineeships were integrated back into the Study Programme and Adult Education Budget from 1 August 2023. This will be the last apprenticeships and traineeship release to include data for traineeships. This will be refreshed in November 2024 to include the final completion and conversion data on traineeships. From January the renamed apprenticeship release will only contain apprenticeship data.
The figures in this section relate to full-year final data up to and including the 2022/23 academic year and were first published in November 2023.
Traineeships are designed to be a stepping-stone to either an apprenticeship, or other work. They were introduced in the 2013/14 academic year to equip young people with work preparation/experience and basic skills. Young people aged up to and including 24 are eligible for traineeships.
Traineeship starts
There were 11,610 traineeship starts recorded in the 2022/23 academic year – a decrease of a quarter compared to 2021/22 and lower than recorded in any previous year.
Of these 11,610 starts:
- Trainees aged under 19 accounted for 72.2% (8,380)
- Females accounted for 42.8% (4,970)
- Ethnic minorities (excluding white minorities) represented 32.9% (3,780)
- Learners declaring a learning difficulty and/or disability (LLDD) accounted for 29.4% (3,340)
Region
The North West and London had the highest number of traineeship starts in 2022/23.
Completion rates and conversions into apprenticeship starts
(Updated in November 2024)
For transparency, we have refreshed completion and conversion data in November 2024 to include the outcomes of traineeships that were started during the 2022/23 academic year.
Completion rates
Of the 11,610 traineeships started in the 2022/23 academic year:
- 71.3% were completed, a fall of 6.1 percentage points on the rate for those started in 2021/22.
- 850 were completed under flexible arrangements (with a duration of greater than 6 months), representing 10.2% of all completions.
Conversion into apprenticeship starts
The conversion into apprenticeship starts measure counts the first apprenticeship start that occurs within a year (four ILR quarters) of the traineeship start.
Of the 11,610 traineeships started in the 2022/23 academic year:
- 20.1% led to an apprenticeship start, which is 1.4 percentage points higher than the conversion rate of 18.7% reported for traineeships started in 2021/22.
Note: For any traineeship completion where the duration of the traineeship was greater than 6 months, an additional 6-month period has been allowed to register an apprenticeship start.
Traineeships incentive payments
In September 2020, the government introduced employer incentive payments for traineeships (opens in new tab), to support employers who hosted a work placement experience as part of a traineeship programme.
The scheme ran from September 2020 to July 2022 and permitted employers to claim £1,000 for each placement they hosted; provided the placement lasted minimum of 70 hours and was delivered, as a minimum, over a 10 working day duration. Employers could claim £1,000 for each placement, capped at 10 placements per region across the 9 English regions, in any one academic year
Although the incentive programme ended on 31 July 2022, a number of unprocessed claims remained in the system before this release. We have provided the latest data here but will stop updating traineeship incentives payments figures in future releases.
Up to and including October 2023:
- 7,564 traineeship incentives payments had been made to employers
- 3,285 individual organisations received a traineeship incentive payment
- employers had claimed a traineeship incentive payment for 7,410 individual trainees
Note: since employers could claim for each placement, a trainee may generate more than one payment. For example, if a trainee attended two placements at the same employer in the same academic year, the employer could claim a traineeship incentive payment for each placement. Similarly, if a trainee attended two placements at different employers in the same academic year, each employer could claim a traineeship incentive payment for the trainee.
Traineeship incentive payments by local authority district
The ‘Traineeship incentive payments by October 2023’ CSV file in the ‘Additional supporting files’ section provides breakdowns of the numbers above based on the local authority district (LAD) of the learner’s home postcode for whom an employer has received a payment.
An employer or organisation may be counted against more than one LAD, where they have claimed a payment for a placement for trainees living in different LADs.
This means the data in the ‘number of organisations receiving an incentive payment’ column of the csv file sums to more than the national total (of 3,285), which counts each individual organisation once only.
Additional featured table
The following featured table offers more detailed breakdowns and combinations of characteristics and is available in our create your own tables tool:
Traineeship starts by provider
Traineeship starts, completions and completion rates, by age group and quarter
Latest Apprenticeships in year data
The cycle of updates for this section now aligns with full academic year data which can be found in the Full year Apprenticeships data section.
Latest headline statistics will resume in this section when we publish quarter one for 2023/24.
Latest Traineeships in year data
The cycle of updates for this section now aligns with full academic year data which can be found in the Full year Traineeships data section.
National achievement rate tables
The following statistics are classified as official statistics and have been produced in line with the Code of Practice for Statistics, rather than being classed as national statistics and accredited as such by the Office for Statistics Regulation (opens in new tab). The statistics are included for transparency purposes.
Data in this section refers to 2021/22 and was first published in March 2023. Data for 2022/23 is planned to be released in March 2024.
The National Achievement Rate Tables (NARTs) present detailed tables of provider level Qualification Achievement Rates (QARs) that we use for performance management and informed choice purposes. Additionally we provide some national summary tables to show overall performance in the sector with a three year time series to enable comparison of change in performance over time.
In March 2020, the Secretary of State announced that the summer 2020 exam series in England would be cancelled to help fight the spread of Coronavirus (COVID-19). This announcement also stated that Government will not publish any school, college or provider-level educational performance data based on tests, assessments or exams for the 2019/20 academic year.
In February 2021, given the continued disruption, it was confirmed this would also be the case for the 2020/21 academic year. As a consequence of the disruption to the assessment process, the government announced a change to its school and college accountability approach (opens in new tab), stating providers will not be held to account on the basis of exams and assessment data from summer 2020. This release will therefore only contain provider level data for 2021/22.
Headline figures at a national level are available to provide a three-year time series, showing data from 2019/20 to 2021/22. That historical data has not been re-calculated and is shown as originally published in March 2022.
Data for years prior to 2019/20 can be found in the Statistics: national achievement rates tables (opens in new tab) collection.
Headline facts and figures
The overall apprenticeship achievement rate has seen a decrease of 4.3 percentage points between 2020/21 and 2021/22 whilst the achievement rate for apprenticeship standards has seen a decrease of 0.4 percentage points.
Changes in achievement rates are dependent on a combination of retention rates and pass rates. Pass rates have decreased by 0.6 percentage points between 2020/21 and 2021/22 whilst retention rates have decreased by 4.0 percentage points.
The apprenticeship achievement rate measure is additionally reliant on the persons continued employment and in some sectors there is higher churn so caution should be used interpreting simple averages because changes in provision mix across sectors will lead to change in overall averages.
Things you need to know about this release
The purpose of including this achievement rate data for 2019/20 and 2020/21 is to maintain the continuity of information and to provide context alongside the achievement volumes found elsewhere in this publication. It is important to maintain transparency by presenting the national level data for this cohort of learners whilst recognising the extraordinary circumstances under which apprenticeships were completed in 2019/20 and 2020/21, as a result of the Covid-19 pandemic.
A number of things will have impacted the data and as a result data should not be directly compared to data from previous years. For example there was an increase in the number of breaks in learning which meant learners being reported in a different year to the one in which they were expected to complete. Different sectors have been affected in different ways.
In 2018/19 only 6,000 learners were carried forward whereas 24,000 and 28,000 were carried forward in 2019/20 and 2020/21 respectively. For 2021/22 we estimate the number of learners being carried forward is 34,000. They have fallen out of scope for 2021/22 and will be included in a future publication.
Impact of the transition from Frameworks to Standards
When looking at achievement rates it is important to consider the impact of programme change in the nature of the provision resulting from the transition of frameworks to standards. Standards are designed to be more demanding than traditional frameworks. The assessment process is also more rigorous with a specific end point assessment phase following completion of training designed to ensure the apprentice is ready to do the job they have been trained for.
The proportion of learners on frameworks and standards has changed significantly since previous years. In 2019/20 the proportion of learners on standards stood at 46%. For 2021/22 the proportion has now reached 85%.
Apprenticeship achievement rates for individual standards and frameworks for 2021/22 can be found in the ‘Apprenticeship Achievement Rates Subject - Standards and Frameworks’ featured table in our create your own tables tool.
Impact of sector subject area
The mix of achievement rates across each sector subject area can be found to vary which can affect the national average, where figures could be found to be misleading.
Only Agriculture, Horticulture and Animal Care saw an increase in 2021/22, by 0.2 percentage points. All other sector subject areas have seen a decrease. The largest decreases, with significant volumes, were seen in Health, Public Services, and Care, decreasing by 7.8 percentage points, and Information and Communication Technology, decreasing by 7.7 percentage points.
For 2021/22 the sector subject areas with the highest achievement rates are Agriculture, horticulture, and animal care (62.4%), Education and Training (61.9%), Leisure and Tourism (59.5%). STEM subjects have an overall achievement rate of 57.3% where as non-STEM subjects have an overall achievement rate of 52%.
Background information
National achievement rate tables are based on underlying Qualification Achievement Rates (QAR) data. Information about the process surrounding QARs can be found here:
Introduction to Qualification Achievement Rates (QARs) (opens in new tab)
How rates are calculated
Information about how QARs are calculated can be found here :
Qualification achievement rates 2021 to 2022 (opens in new tab)
Overall apprenticeship achievement rates by learner characteristics
The figures in this section cover the achievement rates for those learners who are from ethnic minorities (excluding white minorities). Please note the figures for “White” include white minorities.
In 2021/22, learners from ethnic minorities (excluding white minorities) had an overall apprenticeship achievement rate of 48.3%, a decrease of 4.7 percentage points from 53.0% in 2020/21.
As is the case when looking into other learner attributes the variation in achievement rates by ethnicity is mainly driven by the mix of sector subject areas being undertaken. For 2021/22 this is driven by a large cohort volume of 10,850 for the Health, Public Services and Care sector (15.7% of all learners were from ethnic minorities (excluding white minorities)) and 11,320 for the Business, Administration and Law sector (14.4% of all learners were from ethnic minorities (excluding white minorities)) with overall achievement rates of 48.1% and 45.7% respectively. By comparison, only 8.1% of learners in the Engineering and Manufacturing Technologies sector were from ethnic minorities (excluding white minorities).
The sector with the highest achievement rate for learners from ethnic minorities (excluding white minorities) was Leisure, Travel and Tourism with 64.5%. The lowest achievement rate was for the Arts, Media and Publishing sector with 42.1%.
Caution should be used interpreting simple averages because differences in provision mix across sectors will lead to change in overall averages. Press the green ‘Explore data’ button above to look at the data by age, level, sector subject area.
Apprenticeship overall achievement rates by detailed level
Achievement rates at levels 6 and 7 increased in 2021/22 when compared to 2020/21. Achievement rates decreased at all other levels.
For data on individual providers for 2021/22 please see the featured table called ‘Apprenticeship achievement rates by provider’ in our create your own tables tool.
2021/22 is the first year in which a fair comparison can be drawn for apprenticeships supported by ASA levy funds. The levy was first introduced in 2017 but, given that achievement rates are calculated using a multiyear data set, 2021/22 is the first year in which significant volumes of those who would have started under the levy system can be observed.
Additional featured tables
The following featured tables offer more detailed breakdowns and combinations of characteristics and are available in our create your own tables tool:
Apprenticeship Achievement Rates by age and level
Apprenticeship Achievement Rates by individual standard / framework
Apprenticeship achievement Rates by provider
Apprenticeship Achievement Rates by provider type and level
To view achievement rates by provider, with provider type, please see the supporting ‘Apprenticeship Achievement Rates - By Provider with Provider Type’ file in the ‘Additional supporting files’ accordion.
Redactions
We have redacted two providers from our formal performance tables (NARTs) where we are unable to form a reliable QAR. This is done where the data we hold does not allow us to calculate a reliable estimate and therefore provides an unfair measure of performance. We publish headline information for these providers separately for transparency, but they do not constitute a formal QAR and should not be used to compare performance. The underpinning data is included in our national achievement rates to provide a complete view of performance. Details can be found in the ‘Apprenticeship Achievement Rates – Transparency Redactions.pdf’ supporting file in the ‘Additional supporting files’ accordion.
Traineeships
Positive destination rates have been calculated for Traineeships for the first time and are provided here for transparency. Users should note the caveats for these new rates that are based on provider information on destinations and how this compares with existing measures we publish in this release for traineeships on completions and conversion to apprenticeships and in the Outcome Based Success Measures release.
Traineeship positive destination rates are produced to provide a measure of performance that is aligned to other QAR measures for apprenticeships and education and training. In common with other QARs they count the total number of learners who were due to complete in the given year (the denominator). However for Traineeship we determine an achievement (the numerator) as being activity where a positive destination is recorded in the Individualised Learner Record rather than a successful pass of the programme or qualification entered.
Out of the 16,230 traineeships in 2021/22 56.0% had a positive destination recorded.
Points to note on how traineeships QARs are measured
The positive destinations method for traineeships is reliant on providers accurately being able to report destinations in the ILR. 56.0% were reported as going into employment or other forms of training including part time FE learning. A large number of traineeships, 44.0%, are currently reported with “not applicable” as their destination, and these are not counted as having a successful outcome. While many may not be applicable because they did not have a successful outcome, there will be cases where providers do not know the outcome and the learner did find employment or go into other learning.
Technical specifications for how achievement rates are calculated can be found in the Qualification achievement rates 2021 to 2022 (opens in new tab) guidance.
Further information on Traineeship funding rules including how the performance management process works can be found in the ESFA funding for traineeships (opens in new tab) guidance.
Points to note on how traineeship QARs compare with other data published
In the Traineeship section of this release we publish total starts and how many of these completed. This will vary from the QAR measure because this counts all starts observed in the year including those due to complete in the following year. This measure also allows for COVID flexibilities.
In the Traineeship section of this release we also publish conversions to apprenticeships which for 2020/21 were 20.6% This is based on administrative data and takes all the known starts for a year and tracks any learner found in an apprenticeship in the following year. The QAR method only relies on what providers have captured directly or from a learner so this administrative measure is a more complete observation of who goes onto apprenticeships.
The Outcome Based Success Measures statistics publication uses the LEO dataset that brings together DfE, HMRC and DWP records to show positive outcomes over the October to March period after the year a learner completes. The latest data for 2019/20 completers shows 59% had a sustained positive destination and a further 23% having a positive destination that was not sustained (which will include those doing shorter periods of further learning or employment).
Additional featured tables
The following featured tables offer more detailed breakdowns and combinations of characteristics and are available in our create your own tables tool:
Traineeship Positive Destinations by provider
Public sector apprenticeships 2022-23
The following statistics are classified as official statistics and have been produced in line with the Code of Practice for Statistics, rather than being classed as national statistics and accredited as such by the Office for Statistics Regulation (opens in new tab).
Public sector apprenticeships data return 2022-23
Between 1 April 2017 and 31 March 2022, public sector bodies in England with 250 or more staff were set a Government target to employ an average of at least 2.3% of their staff as new apprentice starts. It was a statutory requirement for public sector bodies to report on their progress.
Though no longer a statutory requirement, we asked public sector bodies to continue to collect and report data on their apprenticeships activity in 2022-23 to support transparency and external accountability, and to help maintain the momentum public sector bodies have built up.
Full details relating to the revised guidance can be found in Publishing public sector apprenticeships data: guidance for public sector bodies, April 2023 (opens in new tab).
We published an early subset of this data in July 2023 which focussed on new apprenticeship starts as a proportion of all employees, consistent with the measurement of the previous target. We have now updated data files to include any late submissions and present the full range of indicators collected from organisations, revealing the change in prevalence of apprentices in the public sector workforce between the start and end of 2022-23 across organisations that made a data return.
Figures supplied by public sector bodies (up to and including 2 November 2023) show that for the period covering 1 April 2022 to 31 March 2023:
- New apprenticeship starts represented 1.7% of total employees. This is slightly lower than the 1.8% reported between the same dates in the previous year.
- A combined total of 61,100 new apprenticeship starts were reported.
- Apprentices continue to be increasingly popular in the public sector workforce. The percentage of employees who were apprentices rose from 3.3% to 3.6% between the start and end of the latest 2022-23 period.
- Apprenticeship starts by new and existing employees represent around one-tenth the volume of all employment starts in the public sector (10.6% in 2022-23)
Sub-sectors
There was variation in the recruitment of apprentices in distinct parts of the public sector. During the period April 2022 to March 2023:
- The armed forces had the highest proportion of apprenticeship starts, with 5.8% of their employees starting an apprenticeship.
- The take up of police constable and operational firefighter apprenticeship standards have contributed to the police and fire authorities being the next highest employers, both at 2.6%.
- The Civil Service, at 1.7%, was in line with the national average for the whole public sector.
- Academy trusts and local authority maintained schools have the lowest rate of apprenticeship recruitment, averaging at 1.0% and 0.6% respectively.
- Between the start and the end of the reporting period, all areas of the public sector increased the proportion of staff who were employed as an apprentice. The largest increases were seen in the armed forces and the police (both increasing by 1.6 percentage points during the year, with the percentage of staff who were an apprentice rising to 17.1% in the armed forces and to 5.6% in the police).
School returns
For the 2022-2023 period, we modified the data collection to allow local authorities who are responsible for maintaining schools to separate out staff in schools from the total local authority headcounts and apprentices as reported in previous years.
State funded schools employing more than 250 staff and not maintained by a Local Authority (e.g. academies and academy trusts) came into scope for the previous target from 31 March 2018.
From the public sector returns, there were 3,800 new apprentices reported in academy trusts in 2022-23. There were an additional 2,800 apprenticeship starts in schools administered by local authorities between April 2022 and March 2023.
Historical public sector apprenticeships target 2017-18 to 2021-22
Outcomes against the statutory target were first published in the Apprenticeships and traineeships 2021/22 release and detailed information about measurement and the organisations in scope are set out in the Further education and skills statistics: methodology.
We have re-published the historical target data in this release. This includes any organisations that submitted data after the November 2022 publication and not included previously.
Users can find the historical target data for individual public sector organisations in the ‘Additional supporting files’ section of this release.
Additional featured table
The following featured table is available for aggregated historical public sector target data and is available in our create your own tables tool:
Percentage of public sector employees starting apprenticeships by sector between 2017-18 and 2021-22
Additional analysis and transparency data
The following statistics are classified as official statistics and have been produced in line with the Code of Practice for Statistics, rather than being classed as national statistics and accredited as such by the Office for Statistics Regulation (opens in new tab). The statistics are included for transparency purposes.
Apprenticeship adverts and vacancies (UPDATED 30 NOVEMBER 2023)
The apprenticeship adverts and vacancies in this section are a snapshot of Find An Apprenticeship (opens in new tab) (FAA), a digital system supporting apprenticeship advertisement and recruitment. They represent only a subset of the total number of vacancies available across the marketplace, as many apprenticeships are not advertised through this website.
The number of vacancies advertised reflects the total number published on Find an apprenticeship, but may not reflect the actual number of positions available. This is particularly the case for large national employers that may advertise the same positions across multiple locations simultaneously.
There were 17,770 adverts comprising 25,870 vacancies on Find An Apprenticeship between August and October 2023. These are 30.1% and 34.7% respectively down the same period in 2022 when there were 25,420 adverts and 39,590 vacancies.
There were 5,600 adverts, covering 7,830 vacancies on Find An Apprenticeship in October 2023.
The ‘Underlying data – apprenticeship vacancies’ file in the ‘Additional supporting files’ accordion contains more information about the vacancies and adverts published on Find an apprenticeship. This file is updated alongside our quarterly releases. The current file was published in November 2023 and covers vacancies from August 2022 to October 2023.
Find apprenticeship training
For employers looking to take on apprentices, see find apprenticeship training if you're an employer (opens in new tab).
The service can be used to:
- Search for apprenticeship training by job role or keyword
- Find training providers who offer the apprenticeship training you choose
- Find a named training provider you want to use
Employers reporting the withdrawal of apprentices due to redundancy (UPDATED 30 NOVEMBER 2023)
From 30 July 2020, employers have been able to record on the Apprenticeship Service (AS) if an apprenticeship has ended due to a redundancy. This will provide more accurate and timely data on redundancies than that captured via the ‘withdrawal reason’ on the ILR and will be a reliable ongoing source of data.
Additionally, employers can record information about redundancies at a later date on the AS, therefore the information can suffer from ‘data lag’ with information being recorded weeks or months after the redundancy actually happened.
Additional information
For apprentices who have been made redundant, or who are at risk of redundancy, please see the Redundancy support for apprentices (opens in new tab) guidance.
Apprenticeship care leaver’s bursary payments (UPDATED 30 NOVEMBER 2023)
Apprenticeship care leaver’s bursary payments, 2018/19 to 2023/24, reported as at 30 October 2023.
Academic year | 2018/19 | 2019/20 | 2020/21 | 2021/22 | 2022/23 | 2023/24 |
|---|---|---|---|---|---|---|
| Number of bursary payments | 280 | 320 | 210 | 350 | 330 | 30 |
Additional Funding for Employers and Training Providers
In addition to the care leavers’ bursary, training providers and employers receive a payment towards the additional cost associated with training if, at the start of the apprenticeship, the apprentice is:
- aged between 16 and 18 years old, or
- aged between 19 and 24 years old and has either:
- an Education, Health and Care (EHC) plan provided by their local authority or
- has been in the care of their local authority
For more information, please refer to the apprenticeship funding rules (opens in new tab).
Apprenticeship service Commitments (UPDATED 30 NOVEMBER 2023)
Apprenticeship service transfers (UPDATED 30 NOVEMBER 2023)
In April 2018 it became possible for levy-paying organisations to transfer up to 10 per cent of the annual value of funds entering their apprenticeship service account (ASA) to other organisations via the apprenticeship service. This increased to 25 per cent from April 2019.
As of 30 October 2023, there have been 9,900 apprenticeship service commitments entered into the apprenticeship service with training start dates in the 2022/23 academic year, where the transfer of funds between ASAs has been approved. A further 60 commitments were pending approval for the transfer of funds.
The number of fully agreed transferred commitments that have so far been recorded as apprenticeship starts on the Individualised Learner Record (ILR) in the 2022/23 academic year is 9,610.
A csv file containing breakdowns of transfers that have been recorded as starts on the ILR (as published in November 2023) can be downloaded from the ‘Additional supporting files’ accordion (see ‘Underlying data – starts arising from transferred commitments’). This file is updated alongside our quarterly releases, with the next update expected in January 2024.
Please note that providers may not record learners immediately on the ILR, so a lag may occur between a commitment being recorded in the apprenticeship service and the corresponding commitment being recorded as a start on the ILR.
Additionally, as commitments can be recorded/amended on the apprenticeship service system after the transfer approval date has passed, all data should be treated as provisional. Data are only fully captured when providers confirm details in the ILR. In the interests of transparency, what is known at this point of reporting has been included where possible.
Levy transfer matching service (UPDATED 30 NOVEMBER 2023)
Pledges
As of 30 October 2023:
- The total number of pledges made by levy-paying employers was 509.
- The total amount pledged stood at £33.14 million.
Note: these figures reflect the cumulative total of pledges since September 2021. Those that are currently available can be found at Search funding opportunities (manage-apprenticeships.service.gov.uk) (opens in new tab).
Applications
As of 30 October 2023:
- the total number of applications submitted was 16,077 through 2,591 different Apprenticeship Service accounts.
The total number of apprentices applied for was 50,081. This figure will include employers submitting multiple applications for the same funding to different pledges. The number of unique apprenticeship positions applied for is difficult to determine, however it is likely to be in the range of 20 to 50 per cent of the total number of apprentices applied for.
The number of approved applications was 2,902.
Reservations (UPDATED 30 NOVEMBER 2023)
From 01 April 2021, all new apprenticeship starts must be via the apprenticeship service. Employers who do not pay the apprenticeship levy must reserve apprenticeship funding for training and assessment (or have a reservation of funds completed on their behalf). Funding can be reserved up to 3 months in advance of the expected apprenticeship start date and should be reserved before apprenticeship training starts.
As of 30 October 2023:
| Academic Year | 2021/22 | 2022/23 | 2023/24 |
|---|---|---|---|
| Total reservations made: | 169,780 | 138,760 | 51,570 |
| of which deleted: | 4,760 | 2,750 | 590 |
| of which expired: | 40,470 | 27,080 | 0 |
| Non-levy paying apprenticeship service accounts: | 76,190 | 63,850 | 31,910 |
| Supporting providers: | 960 | 960 | 820 |
Additional featured tables
The following featured tables offer more detailed breakdowns and combinations of characteristics and are available in our create your own tables tool:
Commitments by age, payment status, and start month
Monthly starts by funding type and start month
Redundancies by redundancy month and level
Vacancies and Adverts posted on the Find An Apprenticeship website
Recent trends in levels and subjects
In this section we consider the trends in apprenticeship starts by level and subject since 2017. This period has seen the introduction of key reforms to apprenticeships, including the apprenticeship levy, a new funding system and the completion of the transition from frameworks to the new employer-led apprenticeship standards. The transition to standards by 2020 was part of the 2020 vision (opens in new tab) for apprenticeships.
In 2016/17, one in twenty apprenticeship starts (5%) were on standards. A year later this had increased to over two in five (44%) and by 2020/21 very nearly all starts (99%) were on standards. Apprenticeship frameworks were withdrawn to new learners on 31 July 2020, however a small number of starts are recorded after this date in cases where it has been agreed a learner can return to a framework after an extensive break.
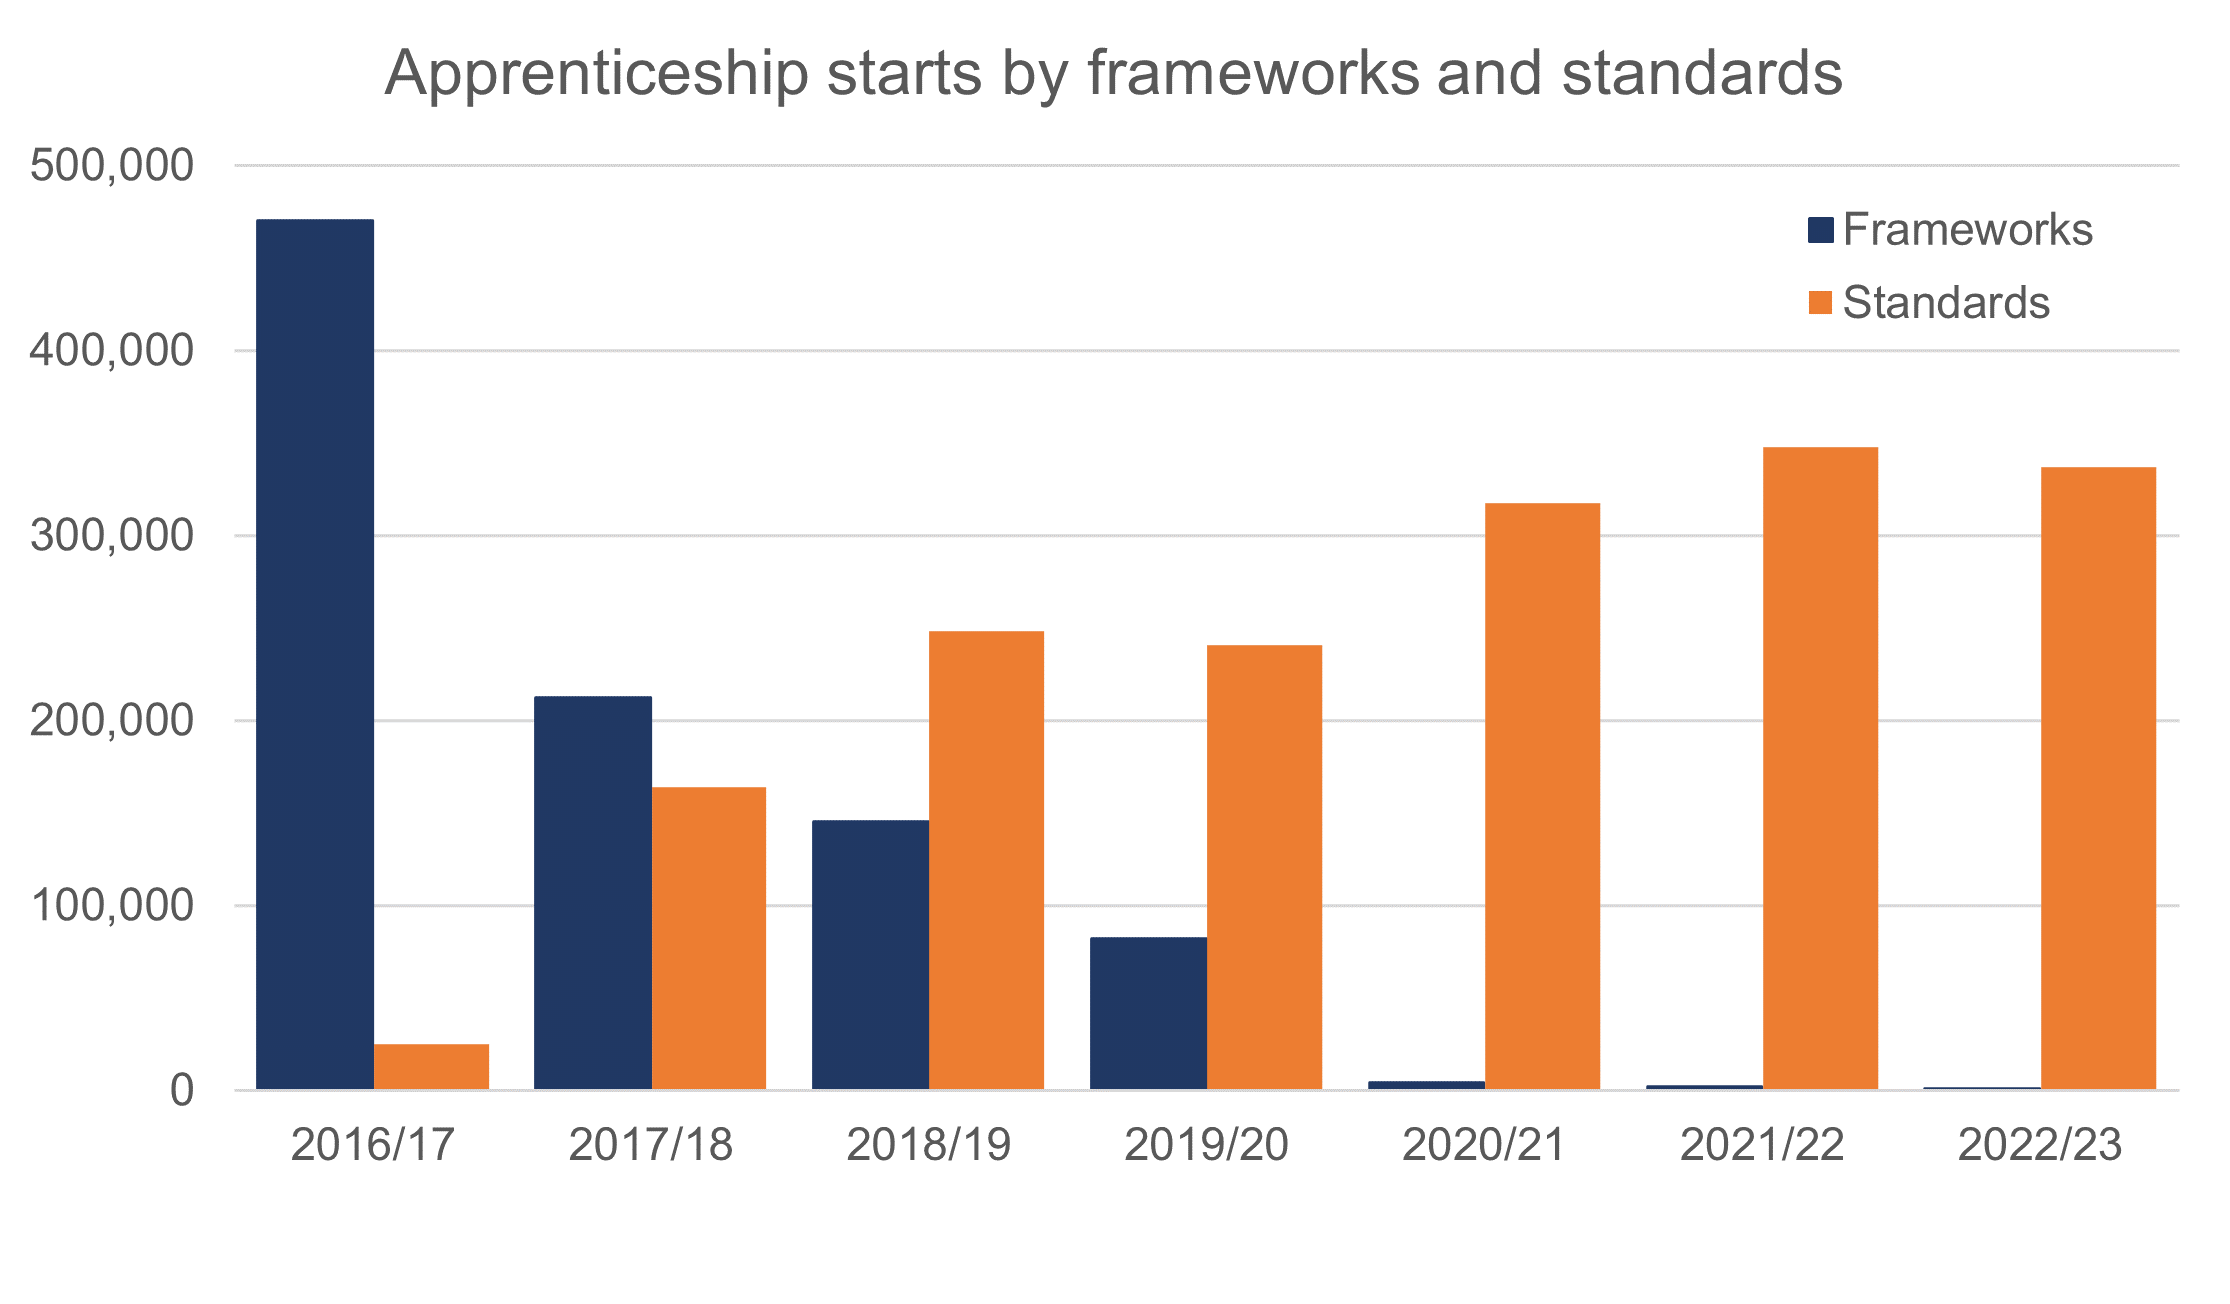
Source: Individualised Learner Record (ILR)
After increasing to 393,400 in 2018/19 (up 5% from a year earlier), apprenticeship starts fell by nearly a fifth (18%) to 322,500 in 2019/20 and remained at a similar level during 2020/21.
Covid-19 restrictions led to a fall in starts and the number of apprenticeship vacancies being advertised, and some employer failure and redundancies. In particular, the months from March to October 2020 saw a substantial reduction in the number of starts.
Apprenticeship starts have since recovered, with a return to the typical seasonal pattern. However, with a total of 337,100 new starts recorded in 2022/23, they remain some 14% below the level seen in 2018/19.
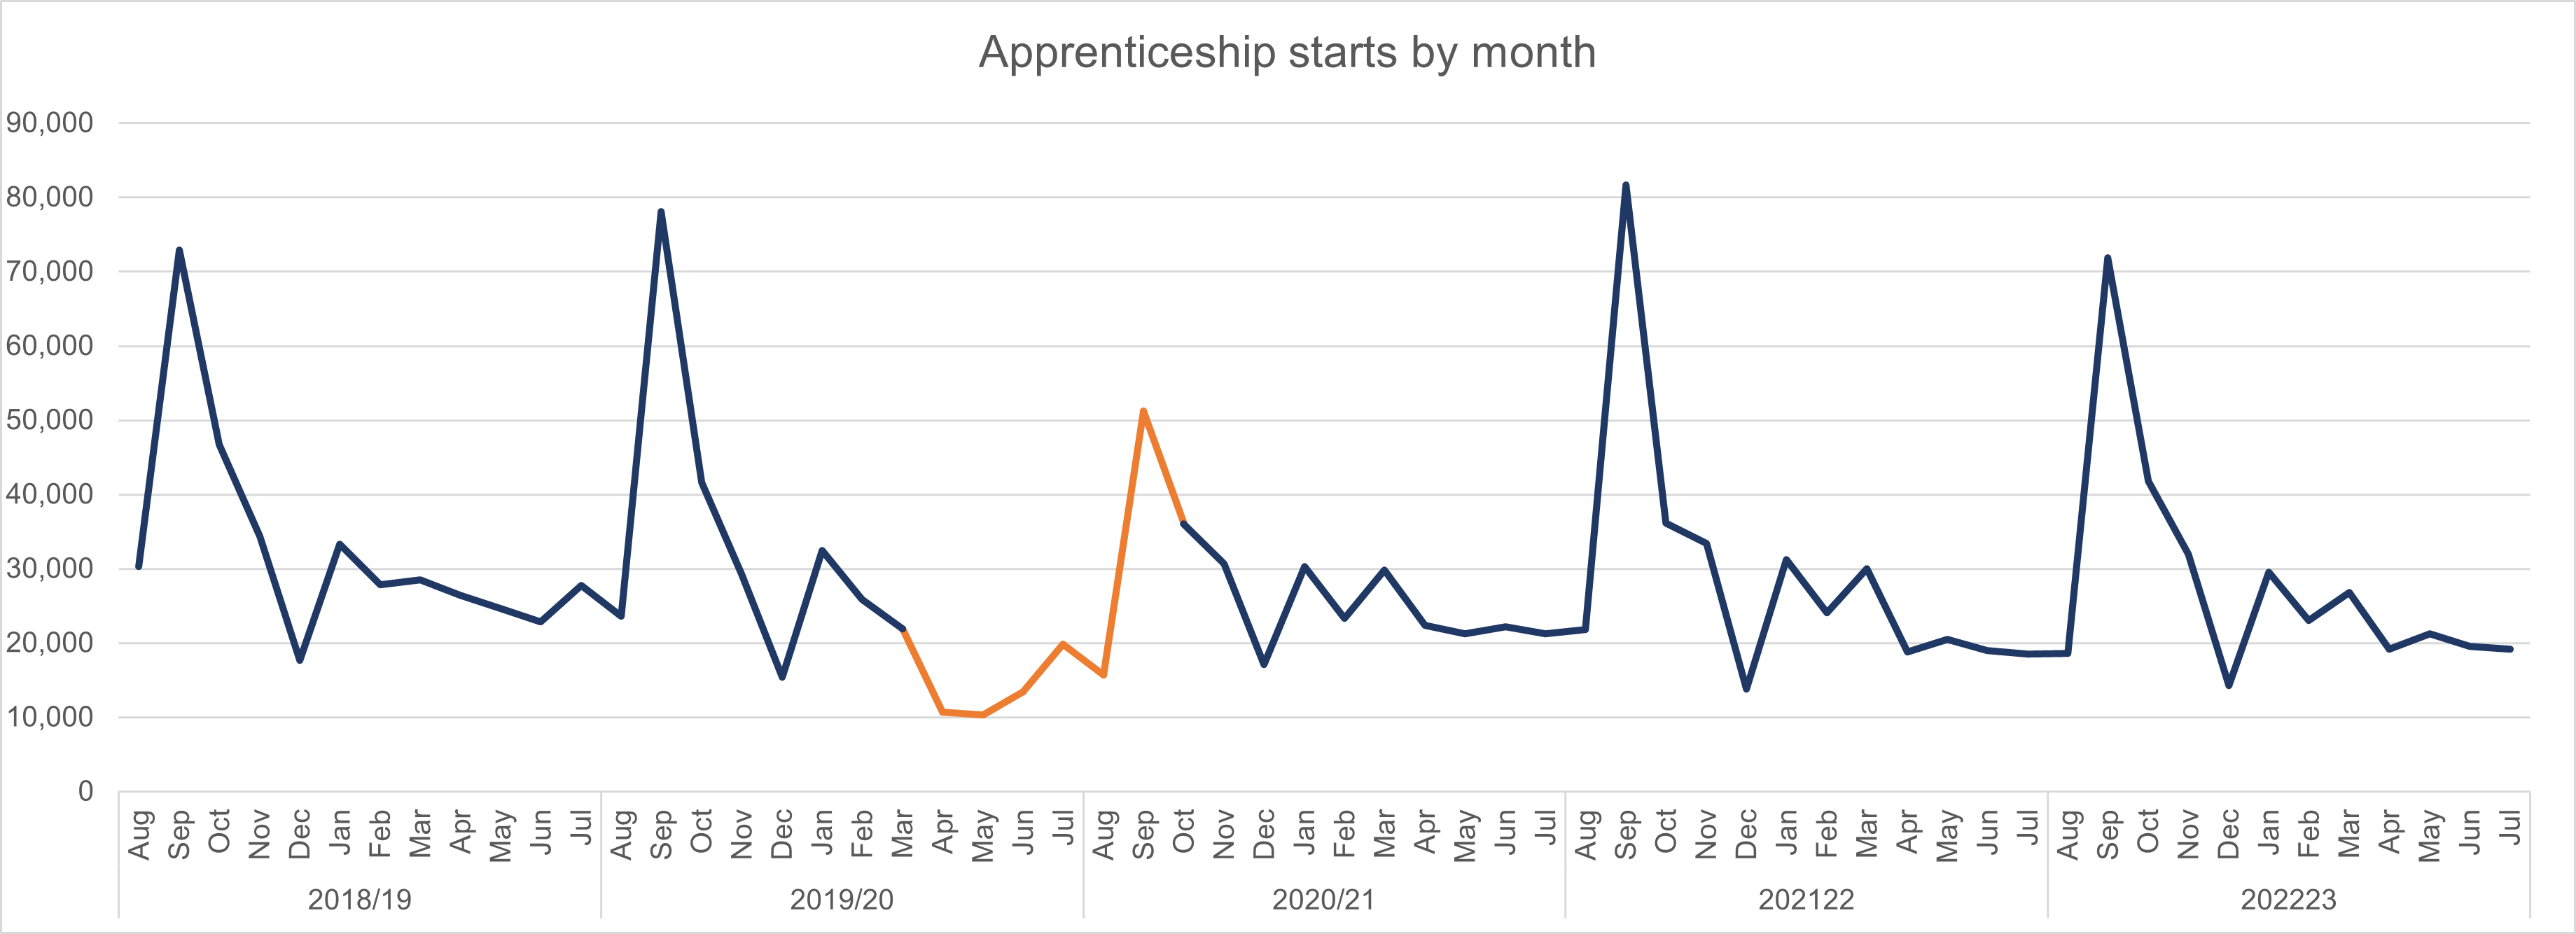
Source: Individualised Learner Record (ILR)
Apprenticeship starts by level
Following reforms to apprenticeships there has been a move away from shorter duration (intermediate) apprenticeship courses towards those of longer duration, with more employers choosing to take up higher level standards as they have become available. Standards are also generally considered to take longer to complete as they include more off the job training and a rigorous end point assessment process.
In 2017/18, there was a similar proportion of apprenticeship starts at intermediate (43%) and advanced level (44%), but less at higher level (13%).
By 2022/23, however, higher level starts accounted for 33% of all apprenticeship starts, whereas intermediate level starts accounted for 23%. The proportion of advanced level starts remained unchanged at 44%.
In 2022/23, the number of higher-level apprenticeships starts was the highest on record and intermediate starts the lowest.
The move towards courses of longer duration means that although the number of apprenticeship starts fell by 14% between 2018/19 and 2022/23, the level of participation increased slightly over the same period, from 742,400 to 752,200. Since apprenticeships now take longer to complete the rate of starts has slowed, but overall participation has remained relatively unchanged.
Higher level apprenticeships
Higher level apprenticeships comprise four separate qualification levels (opens in new tab) (4 to 7), with starts at each level having increased since 2017/18. Degree (level 6) apprenticeships saw consistent year-on-year increases between 2017/18 and 2021/22. Although the rate of increase slowed this year, starts have more than trebled from 6,400 in 2017/18 to 25,000 in 2022/23. Starts in master’s degrees (level 7) more than quadrupled from 4,500 to 21,800 over the same period, although the rate of growth has slowed in the last two years.
Tier 1 sector subject areas
When looking at apprenticeship starts across the tier 1 subject sectors (refer to chart below) we see some differences in trends.
Trends are likely to have be influenced by employer demand for more higher-level courses and greater choice in standards that are being designed with employers.
It should also be noted that we are considering subject areas in this section and not industry sectors. Data published in the department’s latest Apprenticeships in England by industry characteristics shows that industry sectors offer apprenticeships in different subject areas. For example, the construction industry sector accounted for 5,930 (or 16%) of the 37,950 apprenticeship starts in the Engineering and Manufacturing Technologies tier 1 sector subject area in 2020/21.
Health, Public Services and Care has overtaken Business, Administration and Law as the most popular apprenticeship subject, with starts increasing by 12% between 2017/18 and 2022/23 to nearly 99,000. In particular, starts increased between 2019/20 and 2020/21, which may in part reflect an increase in demand in this sector during the covid-19 pandemic.
Growth in Health, Public Services and Care has also been influenced by the public sector apprenticeship target (opens in new tab) and the creation of new standards designed with the sector. For example, starts on the Nursing Associate foundation degree apprenticeship increased from 100 in 2018/19 (the year it first became available) to 4,500 in 2022/23. At degree level, Police Constable (Integrated Degree) and Registered Nurse Degree apprenticeships have both seen increases in starts since they were introduced; with starts in Police Constable (Integrated Degree) rising from 200 in 2018/19 to 4,500 in 2022/23.
Apprenticeship starts in Information and Communication Technology increased by 36% in the two years to 2022/23 and were up from 18,400 to 25,100. It was also the only tier 1 sector subject area to see an increase in starts (up 10%) between 2021/22 and 2022/23. Starts in this sector are now at the highest level on record.
After falling to a recent low of 20,000 in 2020/21, during the covid-19 affected period, starts in Construction, Planning and the Built Environment increased in 2021/22, rising by 31% to 26,100, This represented a six year high for the sector and despite falling in 2022/23, starts remain above pre-pandemic levels at 24,500.
Apprenticeships starts in Retail and Commercial Enterprise fell 35% between 2018/19 and 2019/20, higher than that in any other sector. Starts recovered as covid-19 related restrictions were removed, but at 31,000 remain below the level seen in 2018/19
A similar pattern can be seen for apprenticeship starts in Engineering and Manufacturing Technologies, although the fall between 2018/19 and 2019/20 was considerably less at 13%. Starts have since recovered from a low of 39,500 in 2020/21, reaching 46,000 this year, but remain below the level seen before the covid-19 pandemic.
The number of starts in Business, Administration and Law fell to 94,400 in 2019/20, a decrease of 24,200 (or 20%) compared to a year earlier. They have fallen again since then, but at a slower rate, to 90,700 in 2022/23. Occupation and routes have played a greater role in developing new standards, which in some cases will have provided an alternate standard for employers to choose that have a better fit to their sector than the more traditional business administration frameworks.
Contact us
If you have a specific enquiry about Apprenticeships and traineeships statistics and data:
FE Stats Dissemination
Email: FE.OFFICIALSTATISTICS@education.gov.ukContact name: Matthew Rolfe
Press office
If you have a media enquiry:
Telephone: 020 7783 8300
Public enquiries
If you have a general enquiry about the Department for Education (DfE) or education:
Phone: 0370 000 2288
Opening times
Monday to Friday from 9.30am to 5.30pm (closed on bank holidays)