Apprenticeships
Apprenticeship starts, achievements and participation. Includes breakdowns by age, sex, ethnicity, subject, provider, geography etc.
Quick links
- Published
- Last updated
Background information
This release shows provisional data on apprenticeships in England for the first three quarters of the 2025/26 academic year covering the period August 2025 to April 2026, based on data returned by providers in June 2026.
Please note that the ‘Explore and download data’ section contains the underlying files and featured tables that underpin this release. You can also view featured tables or create your own table using the ‘create your own tables' functionality.
The next update will be in November 2026 and will cover the full and finalised 2025/26 academic year (August 2025 to July 2026).
Headline facts and figures
Starts (Aug-Apr)
308,770
Up 8.7%
What are starts?
The number of all age (16+) apprenticeship programmes started in England.
Participation (Aug-Apr)
735,500
Up 4.6%
What is participation?
The number of all age (16+) learners participating on an apprenticeship in England.
Achievements (Aug-Apr)
146,210
Up 14.0%
What are achievements?
The number all age (16+) apprenticeship programmes achieved in England.
Figures for the 2025/26 academic year so far (August 2025 to April 2026) show:
- Apprenticeship starts increased by 8.7% to 308,770 compared to 284,190 reported for the previous year.
- Learner participation increased by 4.6% to 735,500 compared to 703,110 last year.
Apprenticeship achievements increased by 14.0% to 146,210 compared to 128,290 in the same period last year.
Of the 308,770 apprenticeship starts for the 2025/26 academic year so far (August 2025 to April 2026):
- Higher apprenticeship starts increased by 13.6% to 126,660 compared to 111,520 in the same period last year. Higher level is made up of: Level 4 (41,430 starts, up 15.7%); Level 5 (31,290, starts up 20.6%); Level 6 (25,140, starts up 4.9%); Level 7 (28,800 starts, up 11.6%).
- The sector subject area with the highest number of starts is Business, Administration and Law at 95,980. Starts in Construction, Planning and the Built Environment increased by 5.0% to 23,900 since the same period last year
- Starts supported by Apprenticeship Service Account (ASA) levy funds account for 67.3% (207,900), so far in 2025/26.
Foundation apprenticeships represented 160 starts.
Learner characteristics show:
- Under 19s accounted for 20.6% of starts (63,530).
- Learners recorded as having a Learning difficulty/disability (LLDD) increased by 9.2%, to 49,650 from 45,470 in the same period last year. This accounts for 16.7% of the cohort, compared to 16.6% in the previous year.
- Learners recorded from ethnic minorities (excluding white minorities) backgrounds increased by 21.7% to 59,240 from 48,700 in the same period last year. This accounts for 19.5% of the cohort, compared to 17.4% last year.
About these statistics
This statistical release presents provisional information on all age (16+) apprenticeships starts, achievements and participation in England for the 2025/26 academic year.
Also published are official statistics covering:
- Apprenticeship service commitments
- Employers reporting the withdrawal of apprentices due to redundancy
- Adverts and vacancies as reported on the Find an apprenticeship (opens in new tab) website
A separate release covers overall further education and skills data, please see ‘Further education and skills’. Please note that the FE and skills release includes the adult apprenticeships published here in its headline figures.
Individualised Learner Record (ILR) administrative data
The apprenticeship data in this release are based on the tenth ILR data return from FE and apprenticeship providers for the 2025/26 academic year, which was taken in June 2026. The ILR is an administrative data collection system designed primarily for operational use in order to fund training providers for learners in FE and on apprenticeship programmes.
Quarterly release schedule:
- Quarter 1: Data from August to October published in January
- Quarter 2: Data from August to January published in March
- Quarter 3: Data from August to April published in July
- Full Year: Data from August to July published in November
Note: The academic year in the FE publications covers August to July.
National achievement rate tables data
Figures in the ‘national achievement rate tables’ section are as published in March 2026. These official statistics cover achievement rates for the 2024/25 academic year and would have been previously released as part of the standalone National achievement rate tables publication.
Apprenticeship Units
Apprenticeship units (opens in new tab) offer short and targeted training based on existing apprenticeship occupational standards. They help employers address specific and urgent skills gaps in their workforce. They are not designed for people starting a new career or occupation.
Whilst there are none to report currently, they will be included in a future release. To avoid confusion with full apprenticeship delivery we will include details in the Further Education and Skills publication.
How to find data and featured tables in this release
The content of the publication contains charts and tables which highlight key figures and trends that give an overview of the national picture of the apprenticeship landscape.
At relevant points within each commentary section there are links to “featured tables” that offer the next level of detail behind each of the tables embedded within the release. The table builder tool “featured tables” sit within, also enables the user to amend content, reorder and take away to meet their needs.
The user can also choose just to explore the data within this release by using the ‘Explore and download data’ section. Here the user can either select “view or create your own tables” to view all of the ready-made “featured tables” in a single list, or build their own table by selecting a datafile that underpins the release, or use one of the featured tables as a starting point.
There are also dashboards that provide interactive presentation of our published data, with a number of different views on to data and ‘drilldown’ capability to allow users to investigate apprenticeship provision. It is particularly helpful in viewing data across different geographical areas and providers. See the Data dashboards section for the dashboard links.
This release also contains a ‘Supporting files’ section containing mainly csv files that can be downloaded, which provide some additional breakdowns including unrounded data. They are provided for transparency to enable analysts to re-use the data in this release. A metadata document is available in the same location which explains the content of these supporting files. Please note some of the files are too large for proprietary software such as Excel and may need specialist analysis software such as R, SQL, etc.
Feedback
We continually look to improve our data and statistics and your feedback is important to help us further improve and develop. To provide feedback on this release, please email us at FE.OFFICIALSTATISTICS@education.gov.uk
Full year Apprenticeships data
The figures in this section relate to full-year final data up to and including the 2024/25 academic year and were originally published in November 2025
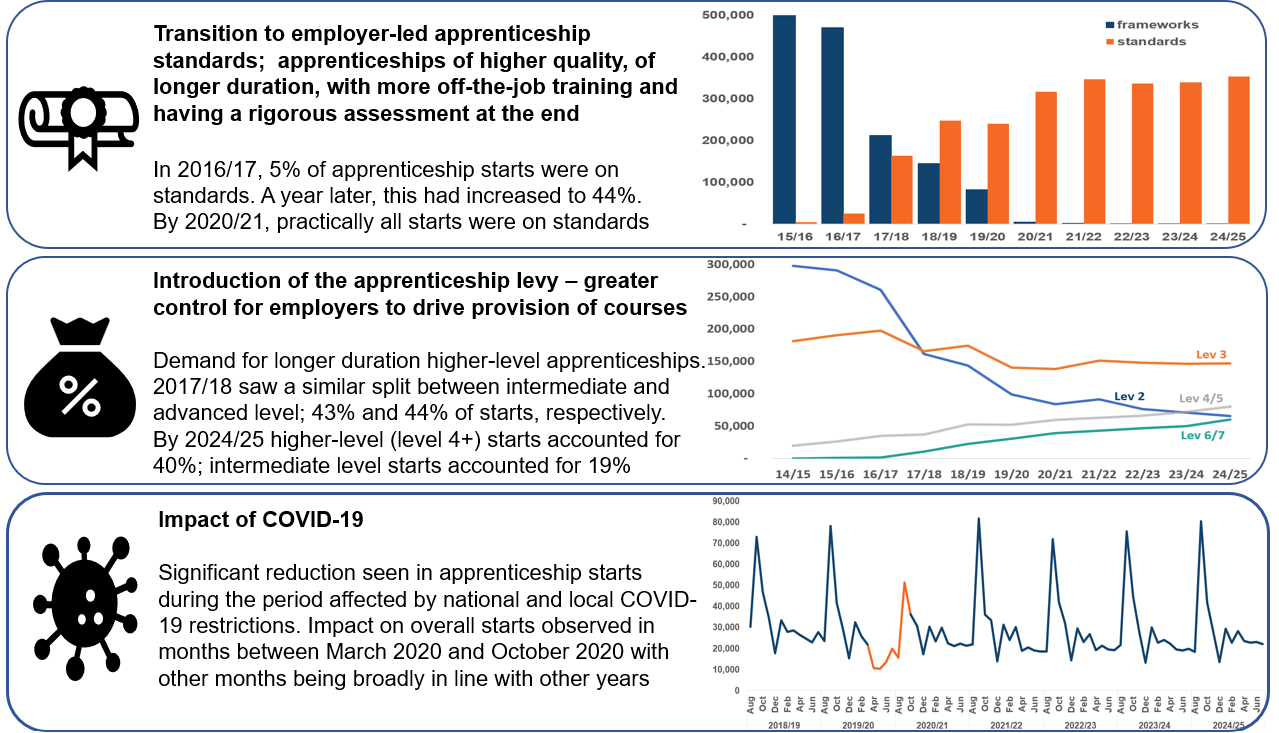
Changing apprenticeship landscape
Reform of the apprenticeships programme, along with the impact of the COVID-19 pandemic have influenced the trends presented in this section. Three main factors are set out in the graphic below.
History of apprenticeship participation
Adult Participation
Participation in apprenticeships by adults aged 19+ in 2024/25 was 630,600 – an increase of 4.4% on the 2023/24 figure of 603,900.
Putting those figures into context, the total number of adults participating in all further education and skills was around 1.8 million in 2024/25.
All age apprenticeship participation by level
There was a steady decline in total participation between 2016/17 and 2020/21 with learner numbers falling by over a fifth from 908,700 to 713,000.
Apprenticeship starts declined at a faster rate than seen for participation during the same period, falling by a third. The transition to apprenticeship standards, the decline in shorter intermediate apprenticeships and the growth in longer apprenticeships at level 4 and above help explain this difference.
Participation has risen to 761,500 in 2024/25, an increase of 3.4% on 2023/24 and 6.8% higher than the recent low in 2020/21.
The continued increase in participation at higher levels has more than offset the decline at intermediate level during this time. Participation in intermediate apprenticeships fell by 52,500 (28.3% between 2020/21 and 2024/25), but higher apprenticeship participation increased by 95,900 (46.1%).
Further information can be found in the following featured table:
Subject, Level and Age
The 353,500 starts reported for the 2024/25 academic year are 4.1% higher than the 339,580 reported for 2023/24, and 4.9% higher than the 337,140 reported for 2022/23.
Final figures reported to the end of 2024/25 show:
- Accelerated growth in higher level apprenticeships with starts at their highest volume and 15.1% greater than in 2023/24. Four in ten starts (39.8%) were at Level 4 and above, compared to 36.0% in the previous year.
- Intermediate level apprenticeship starts continued to fall – 7.3% down on the previous year. Level 2 apprenticeships made up 18.6% of all starts.
- Starts in degree-level apprenticeships (level 6 and 7) have grown from 50,110 to 60,350 and represented 17.1% of all starts in 2024/25.
- Much of the growth in apprenticeship starts in the last year has come at Level 7 and is a likely reaction to the announcement that from January 2026, Level 7 apprenticeships will only be government-funded for young people aged 16 to 21, and for care leavers or those with an Education, Health and Care Plan (EHCP) who are under 25 at the start of their apprenticeship. Starts at Level 7 have increased by 40.7% to 33,560, making up nearly one in ten of all starts in 2024/25.
- Over half of all starts (51.3%) were for apprentices aged 25 and over, increasing from 48.4% in 2023/24. The share of starts for under-19s dropped to 21.2% from 23.2% in the same period. The rise in Level 7 apprenticeships starts explains much of the shift in age profile.
- Science, technology engineering and maths (STEM) subjects accounted for 27.8% of starts – a small decrease from 27.9% in the previous year. 2020/21 saw a disproportionately large drop in starts for STEM subjects – falling by 15.9% compared to 2019/20, while non-STEM grew by 5.8%.
- Business, Administration and Law has increased its status as the most popular tier 1 subject area (accounting for 31.8% of starts). Starts in this subject area increased by 10.5% in the last year, while those in Health, public services and care (the second most popular subject) increased by 1.8%.
- Digital Technology apprenticeships continue to grow. In 2022/23, Digital Technology was the only tier 1 subject area to see a discernible increase in starts compared to 2021/22. During 2023/24, starts increased a further 6.9%, then have risen again by 10.9% in 2024/25. Digital Technology apprenticeships made up 7.7% of all starts in 2024/25.
The apprenticeship sector subject areas in this publication have been updated based on recent Updates to apprenticeship Sector Subject Area (SSA) codes (opens in new tab). The SSA codes for 139 apprenticeship standards have changed. Sector subject areas for past years have been recast to provide a consistent back-series for comparison.
Further information can be found in the following featured tables:
Headline full year comparisons - starts by age
Headline full year comparisons - starts by level
Headline full year comparisons - starts by age and level
Subjects - Starts by STEM, Sector Subject, and Sex
Apprenticeship achievements
Almost two-hundred thousand achievements (198,330) were reported for the 2024/25 academic year, the highest number since 2017/18. Achievements increased for the third successive year, up 11.3% on the 178,220 reported for 2023/24 and following rises of 9.8% and 18.3% in the preceding years.
Unlike the previous two years where achievements increased at every apprenticeship level, 2024/25 saw a fall of 5.5% in intermediate level apprenticeships.
Levy
Total starts supported by ASA levy funds were 243,340; this accounts for over two-thirds (68.8%) of all starts. Please see the Further education and skills statistics: methodology for more information about ASA levy funds.
Length of employment
Apprenticeship starts tend to be by new employees with up to 3 months service, or established workers who have been with their employer for more than 12 months. Since 2021/22, there has been a growth in starts for those employed for more than 12 months and a fall for new employees. In 2024/25, apprentices employed for more than a year accounted for 43.8% of starts (where length of employment was known), compared to 40.5% who had been employed for up to 3 months.
Expected Duration
The expected duration of an apprenticeship is the difference between the associated start date and planned end date as recorded in the ILR.
Final figures for 2024/25 show that the average expected duration of an apprenticeship:
- fell by 1.3% in the last year to 622 days (630 days in 2023/24)
- is significantly higher for level 6 and 7 apprenticeships, though is declining over time.
Ethnicity
Starts by learners from ethnic minorities (excluding white minorities) as a proportion of all starts have increased year-on-year to 18.0% in 2024/25.
Over the five years since 2019/20, the largest growth has been seen in Asian/Asian British apprentices with a 56.1% increase in starts compared to 52.0% for mixed / multiple ethnic groups and 42.6% for Black / African / Caribbean / Black British learners. Starts by white learners increased by 4.3% over the same period.
Sex
Females accounted for 52.5% of starts in 2024/25. This percentage fluctuated over the years affected by Covid, with a high of 53.4% in 2020/21, preceded by a low of 48.8% in 2019/20. The share of starts by females has increased year-on-year since 2021/22.
Learning difficulties
Apprentices declaring a learning difficulty or disability accounted for 16.7% of starts in 2024/25. This proportion has risen steadily from 10.1% in 2015/16.
Further information can be found in the following featured tables:
Learner Characteristics - Starts, Participation, Achievements by detailed learning difficulty/learner disability
Learner characteristics - starts by age group, LLDD and ethnicity
Learner characteristics - Participation by IMD (Index of Multiple Deprivation) quintile and age
Learner characteristics - Starts by age and IMD (Index of Multiple Deprivation) quintile
Starts by funding type, level and age
Duration - Starts by Planned Length of Stay and Age
Region
Starts in 2024/25 show varied trends across regions compared to 2023/24. Most regions recorded an increase in starts, except for the North East, and Outside of England and unknown. The East of England experienced the largest rise (7.2%), while the North East (-0.7%) and Outside of England and unknown (-1.3%) saw slight declines.
When adjusting for population size, London continues to have the lowest rates of starts, participation, and achievement, despite its strong percentage growth. In contrast, the South West has the highest rates for starts, followed closely by the North East and Yorkshire and the Humber. The North East has the highest rate for achievements.
Apprenticeship starts, participation and achievement rates per population are also available at local authority district (LAD) level available via the ‘Explore data’ button in the map above.
Richmondshire historically had much higher rates than other areas due to Catterick Garrison and the prevalence of Army apprenticeships. Since joining the North Yorkshire unitary authority in 2022/23, rates remain above the national average but are far lower than Richmondshire’s previous levels.
Gosport and Fareham had the highest rates in 2024/25, due to the Royal Navy training bases - HMS Sultan in Gosport and HMS Collingwood in Fareham. The Royal Navy, like the Army, has a high apprenticeship uptake.
Further information can be found in the following featured tables:
Geographical - Starts by English Devolved Area by level
Geographical - starts, achievements and participation by level and parliamentary constituencies
Provider Type
Private sector, public funded providers were responsible for over two-thirds of starts (68.3%) in 2024/25 – an increase of 1.6 percentage points on the previous year, and higher than the 60.6% share of starts accounted for by these providers in 2019/20. Over the same period the share of starts in general FE colleges fell from 22.8% in 2019/20 to 15.9% in 2024/25.
Further information can be found in the following featured tables:
Provider starts and achievements
Occupational routes
As well as being organised by subject area, apprenticeship standards each fit into one of 15 occupational routes. The 15 routes group together skilled occupations with related knowledge and skill requirements and form the structure through which all technical education is now delivered. Skills England’s occupational maps (opens in new tab) provide more information on occupational routes and where technical education can lead.
Business and Administration was the most popular route in 2024/25 accounting for just over a fifth (20.2%) of apprenticeship starts. The next four most popular routes all had a similar share of starts, ranging from 10.3% in Education and Early Years to 9.0% in Engineering and Manufacturing.
Starts on the Digital route have more than doubled over the last few years, rising from 14,760 in 2020/21 to 31,410 in 2024/25.
The last year has seen starts fall by over 1,500 in each of the Health and Science, Sales Marketing and Procurement, and Hair and Beauty routes compared to 2023/24.
Latest Apprenticeship in year data
The following figures and charts/tables were published in July 2026 and cover the first three quarters (August 2025 to April 2026) of the 2025/26 academic year:
Starts
- Apprenticeship starts were up by 8.7% to 308,770 compared to 284,190 reported for the same period in the previous year.
- Higher apprenticeship starts increased by 13.6% to 126,660 compared to 111,520 in the same period last year.
- Starts at Levels 6 and 7 rose by 8.4% compared with the same period last year, reaching 53,940. Level 6 starts increased by 4.9% to 25,140 and now account for 8.1% of all starts (down slightly from 8.4% last year). Level 7 starts rose by 11.6% to 28,800 and now represent 9.3% of all starts, up slightly from 9.1% at this point last year.
- Foundation apprenticeships represented 160 starts. Foundation apprenticeships (opens in new tab) are a new programme which will be building over time.
- Under 19 apprenticeship starts have decreased by 5.4% to 63,530 compared to 67,130 reported for the same period in the previous year. 19-24 starts increased by 5.1% to 83,570 and 25+ increased by 17.5% to 161,670 compared to the previous year where they were 79,490 and 137,570 respectively.
- The share of Under 19 apprenticeship starts account for 20.6% of starts (63,530), in comparison the share for 19-24 was 27.1% and for 25+ was 52.4%.
- The proportion of STEM starts by females is 19.5% (17,790). In comparison at this point for 2024/25 it was 17.2% (14,500).
Monthly starts
Learner characteristics
Further information can be found in the following featured tables:
Monthly starts by funding type and start month
Headline in year comparisons by funding type
Headline in year comparisons by level
Headline in year comparisons - starts by age
Headline in year comparisons - starts by region and level
Apprenticeship planned length of stay by age and apprenticeship type (reported to date)
Geographical - starts and achievements by region
Participation
- Learner participation increased by 4.6% to 735,500 compared to 703,110 reported for the same period in the previous year.
- Higher apprenticeship participation has increased by 10.9% to 308,620 compared to 278,350 in the same period last year.
Achievements
Further information : Subjects - achievements in year comparisons by sector subject area
Care leavers' bursaries
Apprenticeship care leavers' bursaries payments, 2018/19 to 2025/26 (reported as at 11 June 2026)
| Academic year | 2018/19 | 2019/20 | 2020/21 | 2021/22 | 2022/23 | 2023/24 | 2024/25 | 2025/26 (reported to date) |
|---|---|---|---|---|---|---|---|---|
| Number of bursary payments | 280 | 320 | 210 | 350 | 330 | 550 | 550 | 570 |
Note: Figures are rounded to the nearest 10.
We estimate care leaver apprentices are under-reported in the ILR. Data on care leavers are also collected in Local Authority data and reported in the Children Looked After publication: Children looked after in England including adoptions, Reporting year 2025 - Explore education statistics - GOV.UK.
Providers can claim additional funding and care leavers can be eligible for a £3,000 bursary. For more information please refer to the Apprenticeships care leavers’ bursary guidance (opens in new tab).
Additional Funding for Employers and Training Providers
In addition to the care leavers’ bursary, training providers and employers receive a payment towards the additional cost associated with training if, at the start of the apprenticeship, the apprentice is:
- aged between 16 and 18 years old, or
- aged between 19 and 24 years old and has either:
- an Education, Health and Care (EHC) plan provided by their local authority or
- has been in the care of their local authority
For more information please refer to the apprenticeship funding rules (opens in new tab).
Additional analysis and transparency data
The following statistics are classified as official statistics and have been produced in line with the Code of Practice for Statistics, rather than being classed as accredited official statistics and independently reviewed as such by the Office for Statistics Regulation (opens in new tab). The statistics are included for transparency purposes.
Apprenticeship adverts and vacancies
The apprenticeship adverts and vacancies in this section are a snapshot of Find An Apprenticeship (opens in new tab) (FAA), a digital system supporting apprenticeship advertisement and recruitment. They represent only a subset of the total number of vacancies available across the marketplace, as many apprenticeships are not advertised through this website.
The number of vacancies advertised reflects the total number published on Find an apprenticeship, but may not reflect the actual number of positions available. This is particularly the case for large national employers that may advertise the same positions across multiple locations simultaneously.
There were 46,640 adverts comprising 69,820 vacancies on Find An Apprenticeship between August 2025 and June 2026. These are decreases of 12% and 23% respectively on the same period the previous year when there were 52,770 adverts and 90,720 vacancies.
Additional data : Vacancies and Adverts posted on the Find An Apprenticeship website by month and level
The ‘Underlying data – apprenticeship vacancies’ file in the ‘Supporting files’ section contains more information about the vacancies and adverts published on Find an apprenticeship. This file covers vacancies from August 2022 to June 2026.
Find apprenticeship training
For employers looking to take on apprentices, see find apprenticeship training if you're an employer (opens in new tab).
The service can be used to:
- Search for apprenticeship training by job role or keyword
- Find training providers who offer the apprenticeship training you choose
- Find a named training provider you want to use
Employers reporting the withdrawal of apprentices due to redundancy
From 30 July 2020, employers have been able to record on the Apprenticeship Service (AS) if an apprenticeship has ended due to a redundancy. This will provide more accurate and timely data on redundancies than that captured via the ‘withdrawal reason’ on the ILR and will be a reliable ongoing source of data.
Additionally, employers can record information about redundancies at a later date on the AS, therefore the information can suffer from ‘data lag’ with information being recorded weeks or months after the redundancy actually happened.
Additional data : Redundancies by redundancy month and level
Additional information
For apprentices who have been made redundant, or who are at risk of redundancy, please see the Redundancy support for apprentices (opens in new tab) guidance.
Apprenticeship service commitments
Additional data : Commitments by age, payment status and start month
Apprenticeship service transfers
In April 2018 it became possible for levy-paying organisations to transfer up to 10 per cent of the annual value of funds entering their apprenticeship service account (ASA) to other organisations via the apprenticeship service. This increased to 25 per cent from April 2019 and 50 per cent from April 2024.
As of 11 June 2026, there have been 17,650 apprenticeship service commitments entered into the apprenticeship service with training start dates in the 2025/26 academic year, where the transfer of funds between ASAs has been fully agreed (with 210 pending approval).
The number of fully agreed transferred commitments that have so far been recorded as apprenticeship starts on the Individualised Learner Record (ILR) in the 2025/26 academic year is 15,840.
A csv file containing breakdowns of transfers that have been recorded as starts on the ILR can be downloaded from the ‘Supporting files’ section (see ‘Underlying data – starts arising from transferred commitments’).
Please note that providers may not record learners immediately on the ILR, so a lag may occur between a commitment being recorded in the apprenticeship service and the corresponding commitment being recorded as a start on the ILR.
Additionally, as commitments can be recorded/amended on the apprenticeship service system after the transfer approval date has passed, all data should be treated as provisional. Data are only fully captured when providers confirm details in the ILR. In the interests of transparency, what is known at this point of reporting has been included where possible.
Levy Transfers matching service
Pledges
As of 11 June 2026:
- The total number of pledges made by levy-paying employers was 1,343.
- The total amount pledged stood at £109.26 million.
Note: these figures reflect the cumulative total of pledges since September 2021. Those that are currently available can be found at Search funding opportunities (opens in new tab).
Applications
As of 11 June 2026:
- the total number of applications submitted was 51,788 through 6,504 different Apprenticeship Service accounts.
The total number of apprentices applied for was 129,450. This figure will include employers submitting multiple applications for the same funding to different pledges. The number of unique apprenticeship positions applied for is difficult to determine, however it is likely to be in the range of 17 to 48 per cent of the total number of apprentices applied for.
The number of approved applications was 8,159.
Apprenticeship service reservations
From 01 April 2021, all new apprenticeship starts have been via the apprenticeship service. Employers who do not pay the apprenticeship levy must reserve apprenticeship funding for training and assessment (or have a reservation of funds completed on their behalf). Funding can be reserved up to 3 months in advance of the expected apprenticeship start date and should be reserved before apprenticeship training starts.
As of 11 June 2026:
| Academic Year | 2021/22 | 2022/23 | 2023/24 | 2024/25 | 2025/26 |
|---|---|---|---|---|---|
| Total reservations made: | 169,800 | 138,860 | 132,910 | 126,490 | 115,540 |
| of which deleted: | 4,780 | 2,870 | 2,060 | 3,120 | 3,950 |
| of which expired: | 48,510 | 38,890 | 28,950 | 21,350 | 13,460 |
| Non-levy paying apprenticeship service accounts: | 76,190 | 63,870 | 61,810 | 59,560 | 54,520 |
Please note that the 2025/26 academic year is partial. All figures are provisional and subject to change, in particular figures covering the most recent academic years.
Flexi Job Apprenticeship Agencies
Flexi-job apprenticeship agencies are an initiative developed by the Department for Education (DfE) in 2021. They are organisations that recruit and employ apprentices and arrange placements with multiple host businesses for the duration of their apprenticeship. They aim to support sectors and occupations that often use short-term contracts or other non-standard employment models, such as construction, digital, and creative industries. They also help employers and apprentices overcome barriers that prevent them from using the traditional apprenticeship model, such as lack of flexibility, commitment, or funding. Flexi-job apprenticeship agencies provide a managed apprenticeship service that benefits both employers and apprentices.
Employers and apprentices can use an approved flexi-job apprenticeship agency where the agency:
- employs the apprentice for the duration of their apprenticeship
- arranges placements with host businesses
Apprenticeship starts and achievements through flexi-job apprenticeship agencies (FJAAs), 2021/22 to 2025/26
| Academic year | 2021/22 | 2022/23 | 2023/24 | 2024/25 | 2025/26 |
|---|---|---|---|---|---|
| FJAA apprenticeship starts | 120 | 640 | 940 | 890 | 750 |
| FJAA apprenticeship achievements | 10 | 30 | 250 | 430 | 390 |
Source: Apprenticeship service commitments (as at 11 June 2026) matched to starts and achievements recorded on the ILR.
Note: Figures are rounded to the nearest 10. The 2025/26 academic year is partial, whereas previous years cover the full year. Starts through flexi-job apprenticeship agencies (FJAAs) are identified by matching commitments made by employers on the Apprenticeship Service (AS) to starts recorded by providers in the ILR. A specific code on the AS identifies FJAA commitments and providers are able to use LDM code (opens in new tab) 386 to identify those apprentices employed by FJAAs. Matched starts are counted if they carry either of these codes and the employer is identified as being on the register of FJAAs (opens in new tab).
Achievements are recorded where the learner has completed an apprenticeship programme aim in an academic year and has successfully passed an end point of assessment. Apprenticeships generally take over a year or more to complete, so comparisons of starts and achievements in an individual year will be misleading.
A small number of starts (fewer than 50) have not been included above, where the provider has recorded the associated LDM code on the ILR but so far no match to the apprenticeship service has been made.
Recent trends in levels, subjects and standards
The figures in this section relate to full-year final data up to and including the 2024/25 academic year and were first published in November 2025.
The period from 2017 to 2025 saw the introduction of key reforms to apprenticeships, including the apprenticeship levy, a new funding system and the completion of the transition from frameworks to employer-led apprenticeship standards, as well as the impact of the Covid-19 pandemic. DfE’s apprenticeships reform programme (opens in new tab) policy paper provides more information on the reforms during this period.
In 2016/17, one in twenty apprenticeship starts (5%) were on standards. A year later this had increased to over two in five (44%) and by 2020/21 very nearly all starts (99%) were on standards.
Apprenticeship frameworks were withdrawn to new starters on 31 July 2020. However a small number of apprentices did start on frameworks after this point, where it was agreed they could resume on a previous framework after returning from a break in their apprenticeship programme.
Apprenticeship starts on frameworks and standards, 2016/17 to 2024/25
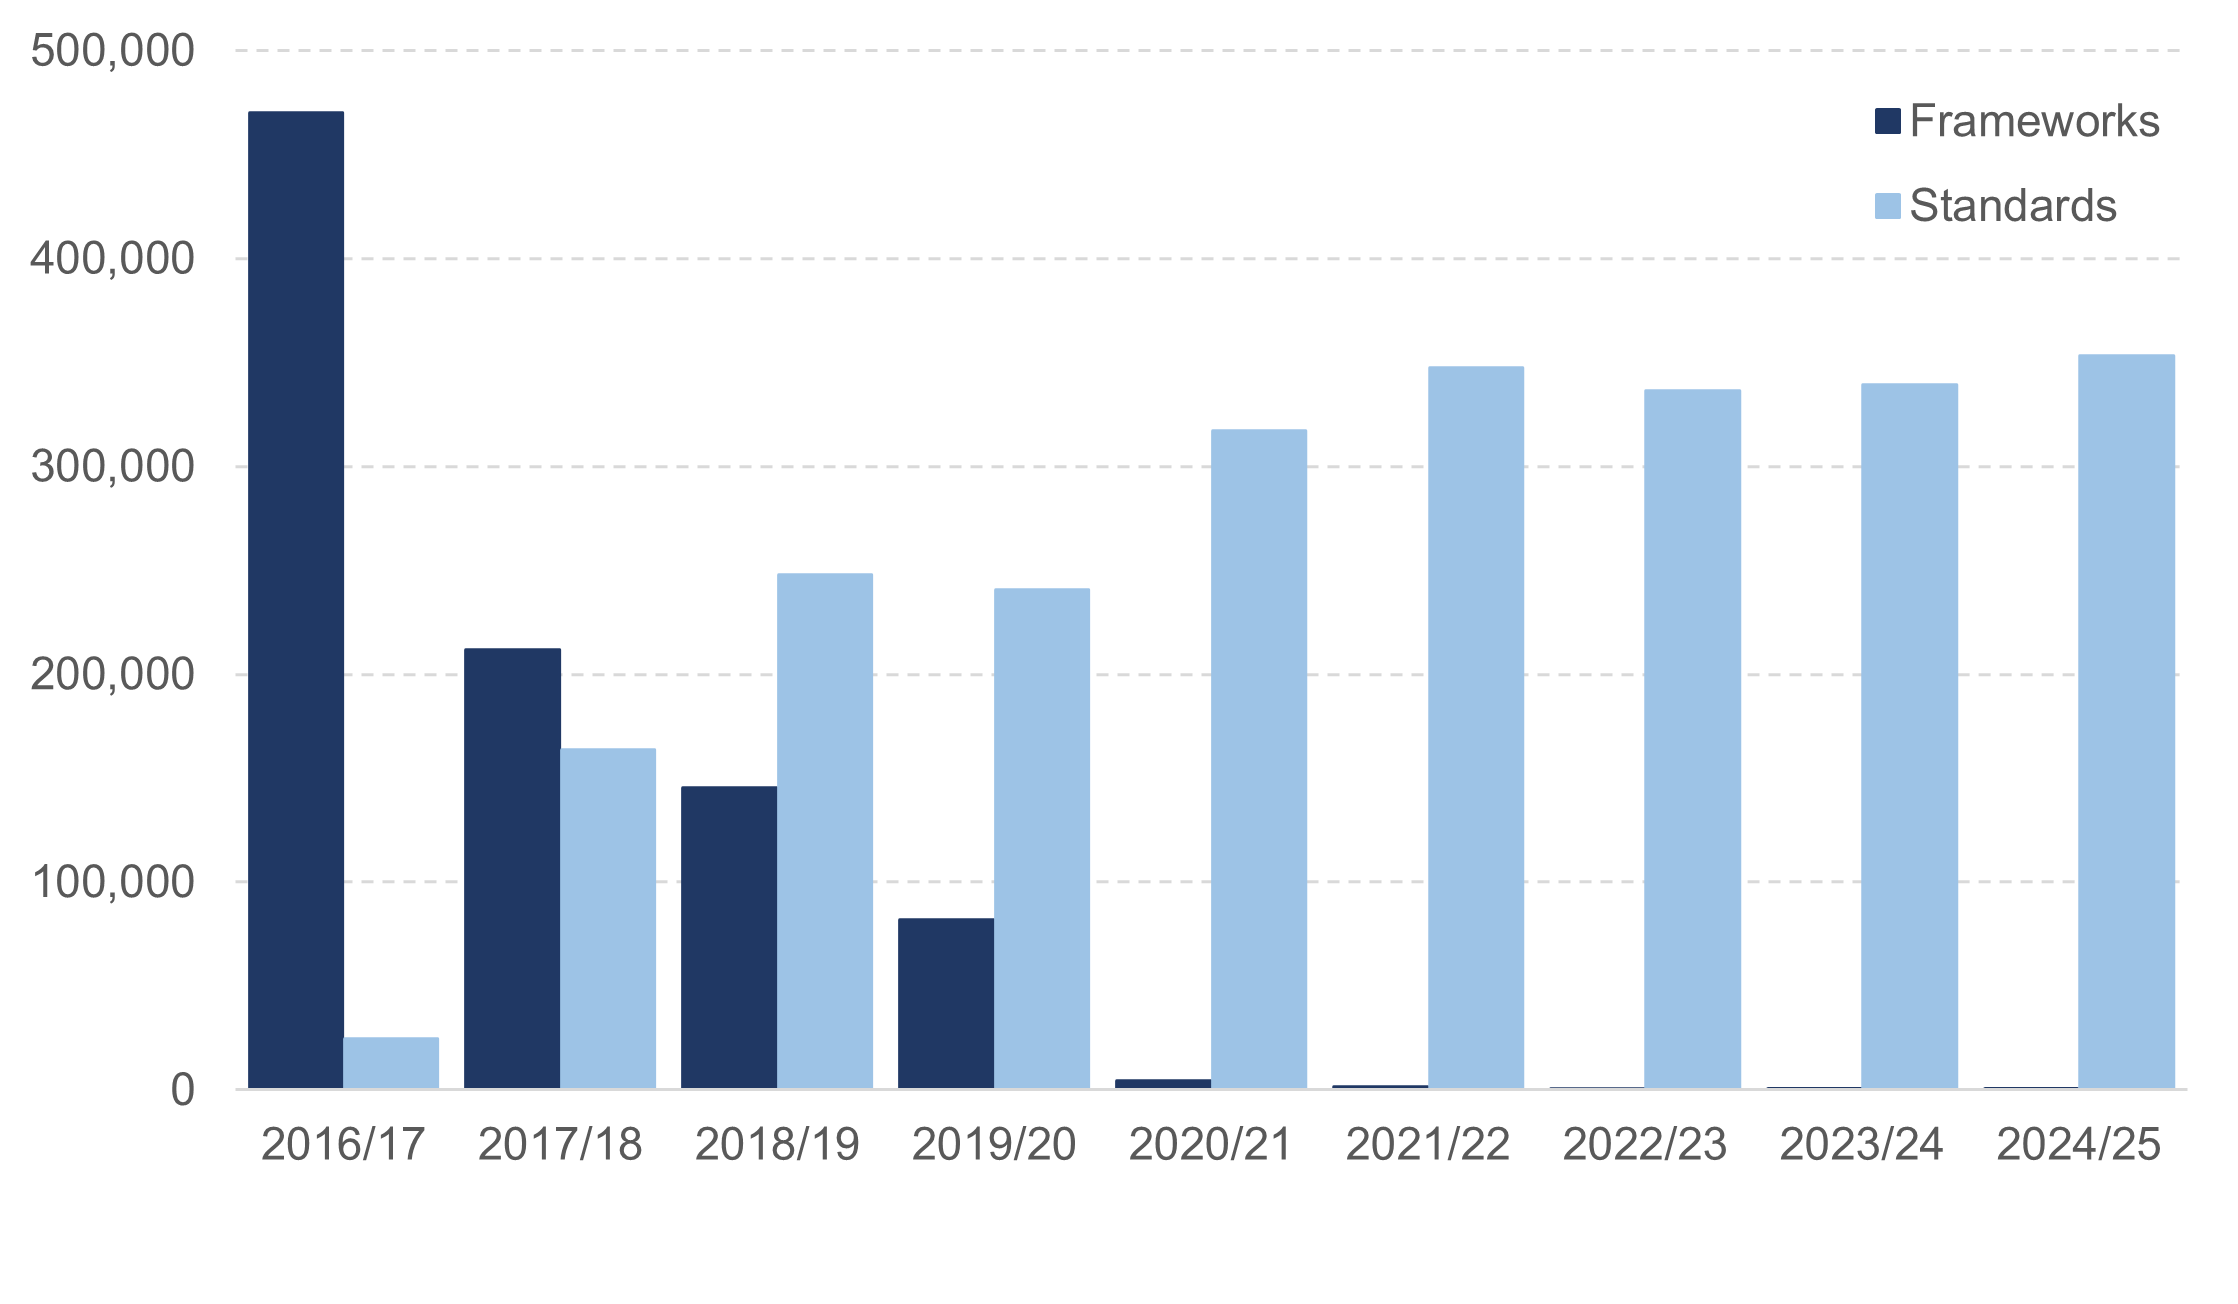
Source: Individualised Learner Record (ILR)
After increasing to 393,400 in 2018/19 (up 5% from a year earlier), apprenticeship starts fell by nearly a fifth (18%) to 322,500 in 2019/20 and remained at a similar level during 2020/21.
Covid-19 restrictions led to a fall in starts and the number of apprenticeship vacancies being advertised, and some employer failure and redundancies. In particular, the nine months from March to October 2020 saw a substantial reduction in the number of starts.
Apprenticeship starts then recovered, with a return to the typical seasonal pattern. However, with a total of 353,500 new starts recorded in 2024/25, they remained some 10% below the level seen in 2018/19.
Apprenticeship starts by month, 2018/19 to 2024/25
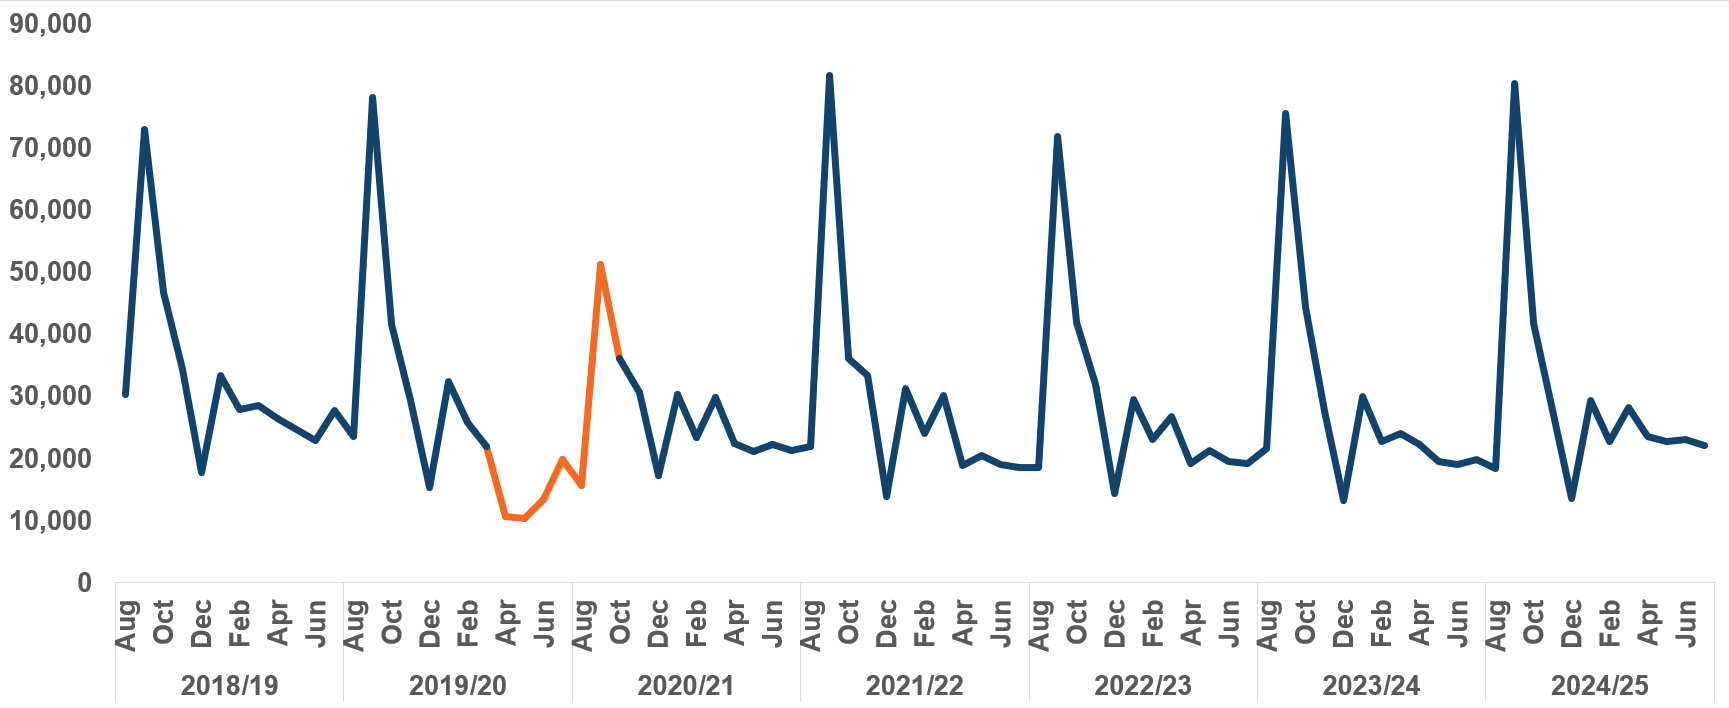
Source: Individualised Learner Record (ILR)
Apprenticeship starts by level
The reforms to apprenticeships saw the development of employer-led standards to replace existing frameworks. This resulted in a move away from shorter duration (intermediate) apprenticeship courses towards those at a higher level and of typically longer duration.
Standards are designed to meet the requirements of occupations and industry sectors. They generally take longer to complete than frameworks as they include more off the job training and a rigorous end point assessment process.
In 2017/18, there was a similar proportion of apprenticeship starts at intermediate (43%) and advanced (44%) level, but less at higher level (13%). By 2024/25, higher level starts accounted for nearly 40% of all apprenticeship starts, whereas intermediate level starts accounted for around 19%. Meanwhile the proportion of advanced level starts remained relatively stable at 42%.
In 2024/25, the number of higher-level apprenticeships starts was the highest on record and intermediate starts the lowest.
The move towards courses of longer duration means that while the overall number of apprenticeship starts fell by 10% between 2018/19 and 2024/25, the level of participation increased slightly over the same period, rising by 2.6% from 742,400 to 761,500.
Higher level apprenticeships
Higher level apprenticeships comprise four separate qualification levels (opens in new tab) (4 to 7), with starts at each level increasing between 2017/18 and 2024/25.
Degree (level 6) apprenticeship starts saw year-on-year increases between 2017/18 and 2024/25. Although the rate of growth slowed in the final three years of this period, by 2024/25 starts had more than quadrupled to 26,800 compared to 6,400 seven years earlier.
Starts on apprenticeships which are equivalent to master’s degrees (level 7) also saw rapid growth over this period, increasing more than fivefold from 4,500 to 23,900 in 2023/24 and then by a further 40% to 33,600 in 2024/25. This latter increase came ahead of the January 2026 deadline, since when government funding for level 7 apprenticeships has been limited to young people aged 16 to 21 and care leavers or those with an Education, Health and Care Plan (EHCP) who are under 25 at the start of their apprenticeship.
Tier 1 sector subject areas
The apprenticeship sector subject area (SSA) data in this publication is based on updates (opens in new tab), which were introduced in December 2025. The SSA codes for 139 apprenticeship standards were updated by Skills England to align with the latest Ofqual guidance, therefore figures may not match those released in previous publications.
Starts
When looking at apprenticeship starts across the tier 1 sector subject areas (refer to chart below) we see some differences in trends between 2019 and 2025.
These trends are likely to have been influenced by employer demand for more higher-level courses and greater choice in standards that are being designed with employers. In addition, apprenticeship starts in some subject areas were disproportionately affected by the impact of the Covid-19 pandemic and the associated restrictions.
It should also be noted that we are considering subject areas in this section and not industry sectors. Data published in the department’s Apprenticeships in England by industry characteristics shows that industry sectors offer apprenticeships in different subject areas. For example, the construction industry sector accounted for 7,200 (or 16%) of the 46,000 apprenticeship starts in the Engineering and Manufacturing Technologies tier 1 sector subject area in 2022/23 (as reported at the time).
After falling to a recent low of 97,300 in 2022/23, apprenticeship starts in Business, Administration and Law increased in both of the next two years. Starts saw an annual increase of 5% in 2023/24 and were up by a further 11% in 2024/25 to 112,500, making it once again the most popular subject for new apprentices ahead of Health, Public Services and Care. Much of the increase in 2024/25 was accounted for by starts on level 7 apprenticeships.
Starts in Health, Public Services and Care fell back slightly from a recent high of 98,600 in 2021/22 to 95,100 in 2024/25. Increases in starts seen in the three years up to 2021/22, may in part have reflected an increase in demand in this sector during the Covid-19 pandemic.
Digital Technology saw steady growth over the period, increasing from 17,400 in 2019/20 to 27,400 in 2024/25, with a large rise in 2021/22 followed by consistent year‑on‑year gains. At the same time, its share of total apprenticeship starts grew from 5% to nearly 8%.
After falling to a recent low of 20,200 in 2020/21, during the Covid-19 pandemic, starts in Construction, Planning and the Built Environment recovered strongly in 2021/22, rising by 31% to reach a high of 26,500. Although starts then fell back, they remained relatively stable over the next three years and at 24,500 in 2024/25 were above pre-pandemic levels.
Apprenticeships starts in Retail and Commercial Enterprise fell by 15%, from 31,100 to 26,600, between 2019/20 and 2020/21. Starts then recovered to 33,000 in 2021/22 as Covid-19 related restrictions were removed, but by 2024/25 had fallen to 25,800, which was below the level seen before the pandemic.
Starts in Engineering and Manufacturing Technologies fell by 25% between 2019/20 and 2020/21, to a recent low of 37,800. After recovering to 47,600 a year later, starts fell back once more in 2022/23 and saw little change over the next two years. At 45,100 in 2024/25, they remained below the level seen before the Covid-19 pandemic.
Achievements
Whereas the number of apprenticeship starts reached a low in 2020/21 (the first full academic year affected by the impact of the covid pandemic) the low point for achievements came a year later in 2021/22, with 137,200 recorded that year. This is likely to be explained by a combination of subdued start numbers in each of the preceding two years and covid-related restrictions delaying the completion and awarding of some apprenticeships.
Achievement numbers then recovered, increasing year on year to reach 198,300 in 2024/25; the first time since the pandemic that they had exceeded the 185,100 seen in 2018/19. Achievements increased across all tier 1 subject areas between 2021/22 and 2024/25, with Health, Public Services and Care achievements increasing by 70% to 57,000 and Business, Administration and Law by 39% to 58,700.
National achievement rates tables
The following statistics are classified as official statistics and have been produced in line with the Code of Practice for Statistics, rather than being classed as accredited official statistics and independently reviewed as such by the Office for Statistics Regulation (opens in new tab). The statistics are included for transparency purposes.
Key Headlines
- The overall apprenticeship achievement rate has seen an increase of 4.9 percentage points to 65.4% since last year.
- Rates have increased at all levels, with level 5 showing the biggest increase since last year, an increase of 6.6 percentage points from 59.6% to 66.2%.
- All sector subject areas have seen an increase since last year. The area with the largest change was Health, Public Services and Care with a rate of 66.8%, up 7.4 percentage points on last year.
- The achievement rate for those learners living in the most deprived quintile has increased by 6.1 percentage points from 55.9% to 62.0%.
About these statistics
The National Achievement Rate Tables (NARTs) present detailed tables of provider level Qualification Achievement Rates (QARs) that we use for performance management and informed choice purposes. Additionally we provide some national summary tables to show overall performance in the sector with a three year time series to enable comparison of change in performance over time.
This release includes new data showing 2024/25 as first published in March 2026, along with historical data for 2022/23 and 2023/24. The historical figures have not been re-calculated and are shown as originally published in March 2024 and March 2025 respectively.
Data for years prior to 2019/20 can be found in the Statistics: national achievement rates tables (opens in new tab) collection.
- The highest overall achievement rate is at level 6 with 69.3%. This has increased by 0.2 percentage points compared to 2023/24.
- Level 5 shows the biggest increase since last year, an increase of 6.6 percentage points from 59.6% to 66.2%.
The apprenticeship achievement rate measure is additionally reliant on the persons continued employment and in some sectors there is higher churn so caution should be used interpreting simple averages because changes in provision mix across sectors will lead to change in overall averages.
Changes in achievement rates are dependent on a combination of retention rates and pass rates. Pass rates have increased by 0.4 percentage points between 2023/24 and 2024/25 whilst retention rates have increased by 4.8 percentage points.
Impact of sector subject area
The mix of achievement rates across each sector subject area can be found to vary which can affect the national average, where figures could be found to be misleading.
The apprenticeship sector subject areas in this publication have been updated based on recent Updates to apprenticeship Sector Subject Area (SSA) codes (opens in new tab). The SSA codes for 139 apprenticeship standards have changed. Sector subject areas for past years have been recast to provide a consistent back-series for comparison.
For 2024/25 the sector subject area with the highest achievement rate is Education and Training with 74.8%. The area with the lowest was Construction, Planning and the Built Environment (58.3%). All areas have seen an increase since last year. The area with the largest change was Health, Public Services and Care with a rate of 66.8%, up 7.4 percentage points on last year.
STEM subjects have an overall achievement rate of 64.1%, whereas non-STEM subjects have an overall achievement rate of 65.9%.
Apprenticeship achievement rates for individual standards and frameworks can be found here :
Apprenticeship Achievement Rates by individual standard / framework
Occupational routes
Learner characteristics
Caution should be used interpreting simple averages because differences in provision mix across sectors will lead to change in overall averages. Press the green ‘Explore data’ button above to look at the data by age, level, sector subject area.
The figures in this section cover the achievement rates for those learners who are from ethnic minorities (excluding white minorities). Please note the figures for “White” include white minorities.
In 2024/25, learners from ethnic minorities (excluding white minorities) had an overall apprenticeship achievement rate of 62.7%, an increase of 6.7 percentage points from 56.0% in 2023/24.
As is the case when looking into other learner attributes the variation in achievement rates by ethnicity is mainly driven by the mix of sector subject areas being undertaken. For 2024/25 this is driven by a large cohort volume of 15,150 leavers for the Health, Public Services and Care sector where 18.0% of all leavers were from ethnic minorities (excluding white minorities) and 14,760 for the Business, Administration and Law sector where 16.6% of all leavers were from ethnic minorities (excluding white minorities). Those sectors had overall achievement rates of 65.6% and 59.8% respectively. By comparison, only 9.7% of leavers in the Engineering and Manufacturing Technologies sector were from ethnic minorities (excluding white minorities).
The sector with the highest achievement rate for learners from ethnic minorities (excluding white minorities) was Leisure, Travel and Tourism with 75.7%. The lowest achievement rate was for the Construction, Planning and the Built Environment sector with 51.1%.
Provider type
Split between frameworks and standards
Individual provider rates
Data for individual providers can be found here : Apprenticeship Achievement Rates by provider
Redactions
We have redacted one provider from our formal performance tables (NARTs) where we are unable to form a reliable QAR. This is done where the data we hold does not allow us to calculate a reliable estimate and therefore provides an unfair measure of performance. We publish headline information for these providers separately for transparency, but they do not constitute a formal QAR and should not be used to compare performance. The underpinning data is included in our national achievement rates to provide a complete view of performance. Details can be found in the ‘Apprenticeship Achievement Rates – Transparency Redactions.pdf’ supporting file in the ‘Supporting files’ section.
Further information can be found in the following featured tables:
Apprenticeship Achievement Rates by age and level
Apprenticeship Achievement Rates by individual standard / framework
Apprenticeship Achievement Rates by provider
Apprenticeship Achievement Rates by provider type and level
Background information
National achievement rate tables are based on underlying Qualification Achievement Rates (QAR) data. Information about the process surrounding QARs can be found in the Introduction to Qualification Achievement Rates (opens in new tab) guidance.
How rates are calculated
Information about how QARs are calculated can be found in the Qualification achievement rates 2024 to 2025 (opens in new tab) guidance.
Contact us
If you have a specific enquiry about Apprenticeships statistics and data:
FE Statistics Production and Dissemination Team
Email: FE.OFFICIALSTATISTICS@education.gov.ukContact name: FE Statistics Production and Dissemination Team
Press office
If you have a media enquiry:
Telephone: 020 7783 8300
Public enquiries
If you have a general enquiry about the Department for Education (DfE) or education:
Phone: 0370 000 2288
Opening times
Monday to Friday from 9.30am to 5.30pm (closed on bank holidays)