Widening participation in higher education
Annual statistics on participation in higher education by pupil and study characteristics.
Quick links
- Published
Headline facts and figures
HE Participation Rate by age 19 (Overall)
44.7%
down from 46.0% for the previous cohort but higher than the pre-pandemic rate of 44.5%
2020/21 cohort - Overall
The most recent cohort of 15-year-olds is the 2020/21 cohort who participated in HE by age 19 in 2024/25
HE Participation Rate by age 25 (Overall)
51.3%
up from 50.9% for the previous cohort and the highest in the series
2014/15 cohort - Overall
The most recent cohort of 15-year-olds is the 2014/15 cohort who participated in HE by age 25 in 2024/25
HE Participation Rate by age 25 (Levels 4 and 5)
5.5%
down from 5.7% last year and the lowest in the series
2014/15 cohort - Level 4/5
The most recent cohort of 15-year-olds is the 2014/15 cohort who participated in HE by age 25 in 2024/25
Free School Meals (FSM) - HE Participation Rate by age 19
28.6%
The rate has fallen for the third year running but is higher than the pre-pandemic rate of 28.2%
2020/21 cohort - FSM
The most recent cohort of 15-year-olds is the 2020/21 cohort who participated in HE by age 19 in 2024/25
FSM - Participation Rate Gap by age 19
19.8pp
The gap between FSM eligible and non-FSM eligible pupils is the lowest in the last 4 years but higher than the pre-pandemic gap of 18.7pp
2020/21 cohort - FSM gap
The most recent cohort of 15-year-olds is the 2020/21 cohort who participated in HE by age 19 in 2024/25
FSM - High Tariff Participation Rate Gap by age 19
9.3pp
The gap between FSM eligible and non-FSM eligible pupils is the lowest in the last 4 years but higher than the pre-pandemic gap of 8.8pp
2020/21 cohort - FSM high tariff gap
The most recent cohort of 15-year-olds is the 2020/21 cohort who participated in HE by age 19 in 2024/25
Cohorts of 15-year-olds from English state and special schools are monitored through time to create a percentage of those who have participated in Higher Education (HE). The latest year of HE participation data is from the academic year 2024/25
Participation in Higher Education by age 19 by 2024/25
The most recent cohort were age 15 in 2020/21
Overall
- Overall, 44.7% of the 2020/21 cohort participated in higher education by age 19 by 2024/25. This is down from 46.0% for the previous cohort. However, the participation rate is higher than the pre-pandemic level of 44.5% for the 2016/17 cohort
Pupils eligible for Free School Meals (FSM) at age 15
- 28.6% of the 2020/21 cohort participated in higher education by age 19 by 2024/25. The participation rate has fallen slightly in each of the past three years. The gap in participation rates between FSM eligible pupils and non-FSM eligible pupils was 19.8 percentage points, down from 20.2 percentage points in the previous year and the lowest in the past four years. However, the gap is larger than the pre-pandemic level of 18.7 percentage points for the 2016/17 cohort
- 4.6% of the 2020/21 cohort participated in high tariff HE by age 19 by 2024/25, a decrease from 5.2% for the previous cohort. The gap in participation rates to high tariff HE between FSM eligible pupils and non-FSM eligible pupils decreased from 9.5 percentage points to 9.3 percentage points in the latest year and is the lowest in the past four years. However, the gap is larger than the pre-pandemic level of 8.8 percentage points for the 2016/17 cohort
Participation in Higher Education by age 25 by 2024/25
The most recent cohort were age 15 in 2014/15
Overall
- Just over half (51.3%) of the cohort from 2014/15 had participated in HE by age 25 by 2024/25. This is up from 50.9% for the previous cohort
Level 4 and 5 Study
- 5.5% of the 2014/15 cohort participated at level 4/5 by age 25 by 2024/25. This is down from 5.7% for the previous cohort
New Data Dashboard
A new interactive dashboard (opens in new tab) has been developed to bring all the data in the publication together in a concise, accessible and engaging format. This replaces some of the content previously included in the main release.
The dashboard includes interactive charts and maps of participation rates by age 19 and 25 by tariff group and the full range of characteristics included in the publication
About this release
New Expanded Release
This is the first release to combine statistics previously published in the Participation Measures in Higher Education series with the Widening Participation in Higher Education series. The merge has taken place to expand reporting previously published across the two separate series, but also to bring together data on higher education participation in one place and allow more timely publication.
We continue to develop this publication iteratively and look for opportunities to improve the use of data and align more closely with other related publications in the Department.
If you have any feedback on the current publication or suggestions for future changes please contact us at he.statistics@education.gov.uk
Background Information
This publication presents annual statistics on widening participation in higher education (HE) for pupils who attended English state-funded and special schools, broken down by pupil and study characteristics.
Participation rates relate to a cohort of pupils who were aged 15 at the start of the academic year and who progressed to UK Higher Education Providers and English Further Education Colleges.
The release will focus on participation rates by age 19 and age 25. Participation by age 19 provides a good balance between timeliness and coverage, and age 25 an understanding of participation over a longer time frame
For participation by other ages, users can explore the underlying data for this release. This includes student numbers and participation rates by age 18, 19, 20, 25 and 30 and can be found in the Explore and download data section above. Local authority and regional data is also available to download for key pupil characteristics.
This release is also accompanied by a new interactive dashboard (opens in new tab) that brings together the data in the publication in a concise, accessible and engaging format. This replaces some of the content previously included in the main release.
The dashboard includes interactive charts and maps of participation rates by age 19 and 25 by tariff group and the full range of characteristics included in the publication.
All charts and tables reference the academic year in which a cohort was aged 15
For example, a pupil aged 15 in the 2001/02 academic year (the earliest cohort) would be aged 19 in 2005/06 and 25 in 2011/12. In previous releases, the academic year was based on the year that the cohort was 19
High Tariff Providers
Providers are ranked based on the mean UCAS tariff score of their intake and then allocated to low, medium and high tariff groupings with each forming roughly a third of students in the cohort.
Given the calculation is carried out each year, providers may move in and out of the high tariff grouping over time. This can lead to volatile high tariff participation rates at regional and local authority level if a large local provider moves between tariff groups. Therefore, changes in high tariff participation rates over time should be treated with caution.
Note that the way provider tariff groups are used in the release has changed. Students were previously allocated to the tariff group of the provider they attended at age 19. However, now that we have expanded the publication to cover other ages, students are allocated to the tariff group of the provider based on year of entry
More information about HE provider tariff groupings and the impact of these changes can be found in the methodology document.
The main publication text and accompanying dashboard focus on high tariff providers, however, tariff groupings and mean tariff scores for each institution can be downloaded from the Explore and download data section above.
Prior Attainment
Variations in HE participation by student characteristics can largely be explained by prior attainment [Socio-economic, ethnic and gender differences in HE participation, Nov 2015 (opens in new tab)]. Prior attainment is not accounted for by the measures presented here.
How to use this publication
This is the first release to include statistics previously published in the Participation Measures in Higher Education series.
This release summarises the key statistics from both legacy publications and adds additional breakdowns to the underlying data which can be found in the Explore and download data section.
To enable analysis of the full range of expanded characteristics included in the release, a new interactive dashboard (opens in new tab) has been developed which includes charts and maps of participation rates by age 19 and 25.
The dashboard replaces much of the content in the main release and should be used to visualise changes over time for characteristics of interest such as FSM, Disadvantage, Sex, Ethnic Group, SEN, Children in Need, Children Looked After, Care Leavers, and HE Qualification Level and Type.
The most detailed breakdowns included in the release are available in the underlying data files which include overall figures on participation in HE by individual age and detailed breakdowns by pupil and study characteristics by age 18, 19, 20, 25 and 30.
Given the publication tracks cohorts of pupils into HE, the figures for older ages have a greater lag and different ages will be useful for different purposes.
HE Participation up to age 25
This section shows the initial participation rates for 15-year-old cohorts. This is the percentage entering HE for the first time at the age shown
The chart shows the latest cohort for participation by age 25 (those who were aged 15 in 2014/15 and participated in HE by 2024/25). The vast majority of young people enter HE by age 19 and so the latest figures for HE participation by age 25 largely relate to HE entry in 2017/18 and 2018/19.
Participation by age 19 is therefore likely to provide the best balance between timeliness and coverage in terms of participation in HE by different cohorts.
HE Participation up to age 30
This section shows how the cumulative HE participation rate increases for a single 15-year-old cohort by age
Participation rates up to age 30 are useful for looking at the differences between pupil characteristics.
Some groups in particular are more likely to participate in HE at older ages.
The chart below shows an example of this for Looked After Children using the latest cohort available for figures up to age 30 (those who were aged 15 in 2009/10 and participated in HE by 2024/25).
The participation rate for Looked After Children more than trebled from 6% by age 18 to 20% by age 30. For all other pupils, the rate almost doubled from 25% by age 18 to 49% by age 30.
Participation rates for older ages are also useful when looking at the level and type of qualification being studied in HE. For example, initial entrants to level 4 and 5 study tend to be older than entrants to level 6 study
Impact of COVID-19
Due to the impact of the COVID-19 pandemic, the summer exam series was cancelled in both 2020 and 2021, and alternative processes were set up to award grades.
In both 2020 and 2021, A level attainment increased compared to previous years and was higher than would be expected in a typical year.
The higher A level attainment in 2020 and 2021 led to more students being accepted to HE and in particular to high tariff HE.
As part of the transition back to a normal summer exam series, adaptations were made to the exams (including advance information) and the approach to grading for 2022 exams broadly reflected a midpoint between results in 2019 and 2021.
These changes are likely to have increased the HE participation rate of the 2017/18 to 2019/20 cohorts of 15-year-olds presented in this release (who were 18 between 2020/21 and 2022/23). This will currently affect the time series for those who entered HE by age 22 or under. Comparisons between these years and those of earlier and later years should therefore be treated with caution
Age
Participation in higher education by single year of age
Cohort analysis allows us to examine participation rates by age, tracking cohorts of pupils aged 15 and the proportion that entered HE by different ages.
For example, a pupil aged 15 in 2001/02 (our earliest cohort) would be aged 19 in 2005/06, while a pupil aged 15 in 2020/21 would be aged 19 in 2024/25 (the latest year of HE data). In this publication, therefore, the latest year of HE participation by 19 refers to the 2020/21 cohort, while participation by 25 refers to the 2014/15 cohort.
Cumulative HE Participation Rates
The table below shows the participation rates and high tariff participation rates for each 15-year-old cohort by age of entry to HE. Note, this is cumulative, so for example the age 25 column shows the percentage that entered HE by age 25 rather than entered at age 25
Cohorts of 15-year-olds can currently be tracked from 2001/02 up until participation in HE in 2024/25, when that cohort will have reached age 38
The participation rate by age 19 was 44.7% for the 2020/21 cohort, down from 46.0% the 2019/20 cohort. The participation rate for High Tariff HE by age 19 has also seen a decline (12.1% for the 2020/21 cohort, down from 13.2% for the 2019/20 cohort).
The highest participation rate measured so far using the cohort method was for the 2017/18 cohort of 15-year-olds, of which 52.4% had participated in HE by age 22 in 2024/25.
Level of study
Higher Education (Level 4 and above)
Level of study (opens in new tab) relates to the first qualification the individual was aiming to achieve when they set out in their studies.
Figures by individual level are available in the Explore and download data section and also in the Study Characteristics section below
The chart below shows how the cohort participation rate builds up with age. The majority of pupils participate in higher education by age 19. The participation rate by age 19 therefore provides a good balance between timeliness and coverage of total HE participation.
Participation rates by older age groups give much more lagged information but are useful for comparing participation rates by pupil characteristics given some groups tend to enter HE at older ages.
There has been a generally increasing trend in participation rates by all age groups. HE participation increased during the Covid pandemic and for the latest cohorts we are seeing participation rates fall from those peaks. However, participation rates for the latest cohorts are higher than pre-pandemic rates and there has been a small increase in the participation rate by age 18 in the latest year.
Participation in higher education by age 18
Overall, 34.3% of the 2021/22 cohort participated in higher education by age 18 by 2024/25. This is up slightly from 34.2% for the previous cohort.
Participation in higher education by age 19
Overall, 44.7% of the 2020/21 cohort participated in higher education by age 19 by 2024/25. This is down from 46.0% for the previous cohort. However, the participation rate is higher than the pre-pandemic level of 44.5% for the 2016/17 cohort.
Participation in higher education by age 20
Overall, 48.9% of the 2019/20 cohort participated in higher education by age 20 by 2024/25. This is down from 49.9% for the previous cohort. However, the participation rate is higher than the pre-pandemic level of 48.0% for the 2016/17 cohort.
Participation in higher education by age 25
Just over half (51.3%) of the cohort from 2014/15 had participated in HE by age 25 by 2024/25. This is up from 50.9% for the previous cohort.
Participation in higher education by age 30
Almost half (48.5%) of the cohort from 2009/10 had participated in HE by age 30 by 2024/25. This is up from 47.5% for the previous cohort.
Level 4 and 5 study
This section covers statistics on initial participation towards qualifications at levels 4 and 5 (opens in new tab). Students may take level 4 and 5 qualifications after studying at a higher level, but these students would not be included in these figures.
Levels 4 and 5 include qualifications such as Higher National Certificates, Higher National Diplomas and foundation degrees
The chart below shows how the initial participation rate at level 4 and 5 builds up with age. There has been a general downward trend in the participation rate at level 4 and 5. However, the participation rate by age 18 has remained fairly stable since the 2009/10 cohort and this is also the case for the most recent cohorts who participated in HE by age 19 and by age 20.
Participation at level 4/5 by age 18
2.0% of the 2021/22 cohort participated at level 4/5 by age 18 by 2024/25. This is down slightly from 2.1% for the previous cohort.
Participation at level 4/5 by age 19
3.0% of the 2020/21 cohort participated at level 4/5 by age 19 by 2024/25. This is down slightly from 3.1% for the previous cohort.
Participation at level 4/5 by age 20
3.6% of the 2019/20 cohort participated at level 4/5 by age 20 by 2024/25. This is up slightly from 3.5% for the previous cohort.
Participation at level 4/5 by age 25
5.5% of the 2014/15 cohort participated at level 4/5 by age 25 by 2024/25. This is down from 5.7% for the previous cohort.
Participation at level 4/5 by age 30
7.3% of the 2009/10 cohort participated at level 4/5 by age 30 by 2024/25. This is down from 7.5% for the previous cohort.
Free School Meals
All figures in this section relate to HE participation by age 19. Equivalent figures for age 18, 20, 25 and 30 are available in the Explore and download data section at the top of this page
Note that the proportion of pupils eligible for Free School Meals (FSM) changes over time, which can affect the comparability of the figures.
Since 1 April 2018, transitional protections have been in place during the roll out of Universal Credit, which has meant those eligible for FSM retain their eligibility even if their circumstances change. This has led to an increase in the proportion eligible for FSM in recent years. For the 2020/21 cohort, 18.8% were eligible for FSM at age 15, up from 15.8% in the previous year and the highest in the series up to that point.
See the methodology document for more information
Participation in higher education by age 19
14.4% of state-funded and special school pupils who were eligible for Free School Meals (FSM) at age 15 in 2001/02 entered Higher Education by age 19 in 2005/06. Although the rate had risen fairly steadily over time and is around double the 2001/02 figure at 28.6% for the 2020/21 cohort (HE entry by 2024/25), the participation rate has fallen in each of the past three years. However, the rate is still higher than the pre-pandemic rate of 28.2% for the 2016/17 cohort.
The participation rate for non-FSM eligible pupils has risen from 33.7% for the 2001/02 cohort to 48.4% for the 2020/21 cohort, down from 49.2% last year. The rate is higher than the pre-pandemic rate of 46.9% for the 2016/17 cohort.
The participation rate gap between FSM eligible pupils and non-FSM eligible pupils has remained relatively stable over time. The gap for the 2020/21 cohort was 19.8 percentage points, which is the lowest in the past four years. However, the gap is higher than the pre-pandemic level of 18.7 percentage points for the 2016/17 cohort.
High Tariff Higher Education Participation by age 19
Note that the way provider tariff groups are used in the release has changed. Students were previously allocated to the tariff group of the provider they attended at age 19. However, now that we have expanded the publication to cover other ages, students are allocated to the tariff group of the provider based on year of entry. More information about the impact of this change can be found in the Methodology document
1.7% of state-funded and special school pupils who were eligible for Free School Meals (FSM) at age 15 in 2001/02 entered Higher Education by age 19 in 2005/06. The rate had risen fairly steadily over time to 5.5% for the 2017/18 cohort. However, the rate has fallen in the past two years and was 4.6% for the 2020/21 cohort (HE entry by 2024/25). The rate is also lower than the pre-pandemic rate of 4.9% for the 2016/17 cohort.
The participation rate for non-FSM eligible pupils has risen from 9.5% for the 2001/02 cohort to 13.9% for the 2020/21 cohort, down from 14.7% last year. The rate is slightly higher than the pre-pandemic rate of 13.7% for the 2016/17 cohort.
The participation rate gap between FSM eligible pupils and non-FSM eligible pupils has generally increased over time. However, the gap for the 2020/21 cohort was 9.3 percentage points, which is the lowest in the past four years. The gap remains higher than the pre-pandemic level of 8.8 percentage points for the 2016/17 cohort.
Higher Education Participation by Region and FSM Status by age 19
Higher Education Participation
Higher Education Participation varies considerably by region, in particular for pupils who were eligible for Free School Meals (FSM).
For FSM eligible pupils at age 15:
- Nationally, 28.6% of the 2020/21 cohort had participated in HE by age 19 by 2024/25
- The highest regional rate was in Inner London, where over half (50.8%) participated in HE by age 19
- The South West had the lowest regional rate with 18.4% participating in HE by age 19
For non-FSM eligible pupils at age 15:
- Nationally, 48.4% of the 2020/21 cohort had participated in HE by age 19 by 2024/25
- London again had the highest regional rate – almost two-thirds in both Inner London (65.1%) and Outer London (63.6%) participated in HE by age 19
- The South West had the lowest regional rate with 41.7% participating in HE by age 19
Overall
- These patterns were repeated when looking at the overall HE participation rate with rates highest in London (60.3%) and lowest in the South West (38.2%)
- London was the only region with participation rates notably above the national average of 44.7%
High Tariff Higher Education Participation by Region and FSM Status by age 19
High tariff HE participation also varies by region
- In London, 9.3% of pupils who were eligible for Free School Meals (FSM) at age 15 in 2020/21 participated in high tariff HE by age 19 by 2024/25 – a rate more than three times higher than for the North East (2.8%)
- London also had the highest participation rates for non-FSM eligible pupils at age 15 at 20.2%
- The North East and West Midlands had the lowest participation rate for non-FSM eligible pupils (11.0%)
Overall
- There is a similar pattern when looking at the overall high tariff HE participation rate with rates highest in London (17.7%) and lowest in the North East (9.0%)
- London and the South East were the only regions with participation rates above the national average of 12.1%
Local authority data Figures at local authority level can be downloaded from the Free School Meals file in the Explore and download section at the top of this page
Free School Meals, Sex and Ethnic Group
All figures in this section relate to HE participation by age 19. Equivalent figures for age 18, 20, 25 and 30 are available in the Explore and download data section at the top of this page
This section focuses on detailed ethnic group by free school meal status and sex. Figures by region can be downloaded from the Free School Meals, Sex and Ethnic Group – Region file in the Explore and download data section at the top of this page
Participation in higher education by age 19
Participation rates by age 19 by 2024/25 were highest for Chinese pupils regardless of gender or Free School Meals (FSM) eligibility at age 15 in 2020/21. Chinese females not eligible for FSM had the highest participation rate at 87.8%. Indian, Black African, and Bangladeshi pupils also had consistently high participation rates regardless of FSM eligibility and gender. The lowest participation rates were for Traveller of Irish Heritage, Gypsy Roma, White English/Welsh/Scottish/Northern Irish/British, and White and Black Caribbean pupils.
Participation rates by age 19 by 2024/25 for White English/Welsh/Scottish/Northern Irish/British pupils who were eligible for Free School Meals (FSM) at age 15 in 2020/21 were much lower than most other groups with rates of 21.0% for females and 13.0% for males. The participation rates have fallen for both groups in the latest year.
High Tariff HE Participation by age 19
Participation rates to high tariff HE providers by age 19 by 2024/25 were highest for Chinese pupils regardless of gender or eligibility for Free School Meals (FSM) at age 15 in 2020/21. This was particularly apparent for pupils who were FSM eligible.
Black Caribbean pupils were among the least likely to participate in high tariff HE by age 19 by 2024/25. The participation rate of 5.6% for the 2020/21 cohort was under half the overall national figure (12.1%). The participation rate for females decreased from 10.0% to 7.5% in the latest year and the rate for males has decreased from 4.4% to 3.8%, which is the lowest rate since the 2009/10 cohort.
Pupil characteristics
This section presents some of the detailed information on pupil characteristics that is available through the accompanying dashboard (opens in new tab) and data files.
Data is presented for the latest two years showing HE participation and high tariff participation by age 19. Figures for all available years and by age 18, 20, 25 and 30 are available in the Explore and download data section at the top of this page
Definitions of the pupil characteristics presented can be found in the Methodology document
Participation in higher education by age 19
Participation in HE varies significantly by pupil characteristics, with disadvantaged groups and pupils with Special Educational Needs (SEN) having lower participation rates.
Figures below relate to the 2020/21 cohort of 15-year-olds who participated in HE by age 19 by 2024/25 and the 2019/20 cohort of 15-year-olds who participated in HE by age 19 in 2023/24
- Participation rates are lowest for pupils with an Education Health and Care Plan (EHCP), Care Leavers, Looked After Children and Children in Need, ranging from around 10 to 14% for the latest cohort. Participation rates have fallen for Care Leavers and Looked after Children in the latest year, are unchanged for Children in Need and are up slightly for pupils with an EHCP
- Under a third of Free School Meal pupils, Disadvantaged Pupils and the most disadvantaged pupils (POLAR Q1) participated in HE by age 19
- Participation rates are around 60% or higher for the most advantaged pupils (POLAR Q5), pupils with a first language other than English, Asian / Asian British and Black / African / Caribbean / Black British pupils. Participation rates have increased for Black / African / Caribbean / Black British pupils in the latest year but fallen for most other groups
Regional and local authority data Figures at regional and local authority level can be downloaded from the Free School Meals, Sex, Ethnicity, and Special Education Needs files in the Explore and download data section at the top of this page
Study characteristics
This section presents some of the detailed information on the type of HE study being participated in that is available through the accompanying dashboard (opens in new tab) and data files.
Data is presented for the latest two years showing HE participation and high tariff participation by age 19. Figures for all available years and by age 18, 20, 25 and 30 are available in the Explore and download data section at the top of this page
Study characteristics relate to the first qualification the individual was aiming to achieve when they set out in their studies
Participation in higher education by age 19
Participation in HE varies significantly by the type of study that pupils undertake, with Level 6, First Degrees and full-time study contributing the most to the participation rate.
Figures below relate to the 2020/21 cohort of 15-year-olds who participated in HE by age 19 by 2024/25 and the 2019/20 cohort of 15-year-olds who participated in HE by age 19 in 2023/24
- The majority of participation was at Level 6. The participation rate is 39.1% for Level 6, compared to 2.5% for Level 7, 1.9% for Level 4 and 1.1% for Level 5. The Level 6 participation rate fell by 1.3ppts compared to the previous year, which is reflected in the decline in the overall HE participation rate
- First degrees contributed the most to overall participation. The participation rate is 40.7% for first degrees, followed by apprenticeships at 1.9%. The first degree participation rate fell by 1.3ppts compared to the previous year
- The vast majority of participation was full-time study. The full-time participation rate is 41.9% compared to 0.9% for the part-time rate and 1.9% for apprenticeships
School type (A level students)
All figures in this section relate to HE participation by age 19. Equivalent figures for age 18, 20, 25 and 30 are available in the Explore and download data section at the top of this page
Changes to Key Stage 5 cohort
Reforms to KS5 qualifications and methodological changes to cohort definitions mean HE participation rates from 2013/14 onwards are not directly comparable with earlier years, with further recent changes adding volatility to the time series.
As a result, this publication focuses on A level students in the main text, where the cohort is more stable over time. Participation rates for the wider KS5 cohort are still available for download to enable comparison of participation rates by school type within years, however it is not possible to create consistent comparisons over time.
Data can be downloaded from the School Type file in the Explore and download data section at the top of this page.
Changes to A level cohort
From 2013/14, the cohort includes students who took a single AS level (including alongside vocational qualifications). We would expect these students to have lower participation rates than in the past when the threshold for inclusion in school performance measures was at least one A level. The change has most impact on state-funded students, who are more likely to study AS levels.
Figures from 2013/14 onwards are therefore NOT directly comparable with earlier years
Note that the year presented relates to the year the pupil was aged 15 and not the year they took A levels
Participation in higher education by age 19
86.9% of pupils who took A levels in Independent schools participated in HE by age 19 in 2024/25, 8.4 percentage points higher than for pupils in state-funded schools/colleges (78.4%). The gap between these two groups has increased from 7.0 last year and is the largest gap in five years.
High Tariff Higher Education Participation by age 19
The gap is much larger when focusing on high tariff HE. 58.6% of pupils who took A levels in Independent schools participated in high tariff HE by age 19, 31.7 percentage points higher than those in state-funded schools/colleges (26.9%). This gap is up slightly from 31.4 percentage points last year.
Projecting future HE participation
Projecting HE participation by age 25
This section includes projections of HE participation by age 25 for recent cohorts of 15-year-olds to provide an indication of the likely trends in participation
The vast majority of HE entry relates to 18 and 19-year-olds. We can therefore project HE participation by age 25 up to seven years ahead of the latest age 25 cohort (2014/15) with some degree of reliability.
To do this we take the latest known initial participation rate by age and assume the rates remain at the same level for the later cohorts. This is illustrated in the table below where the white cells are actual rates and the blue cells estimated.
Illustration of calculation of projected participation by age 25
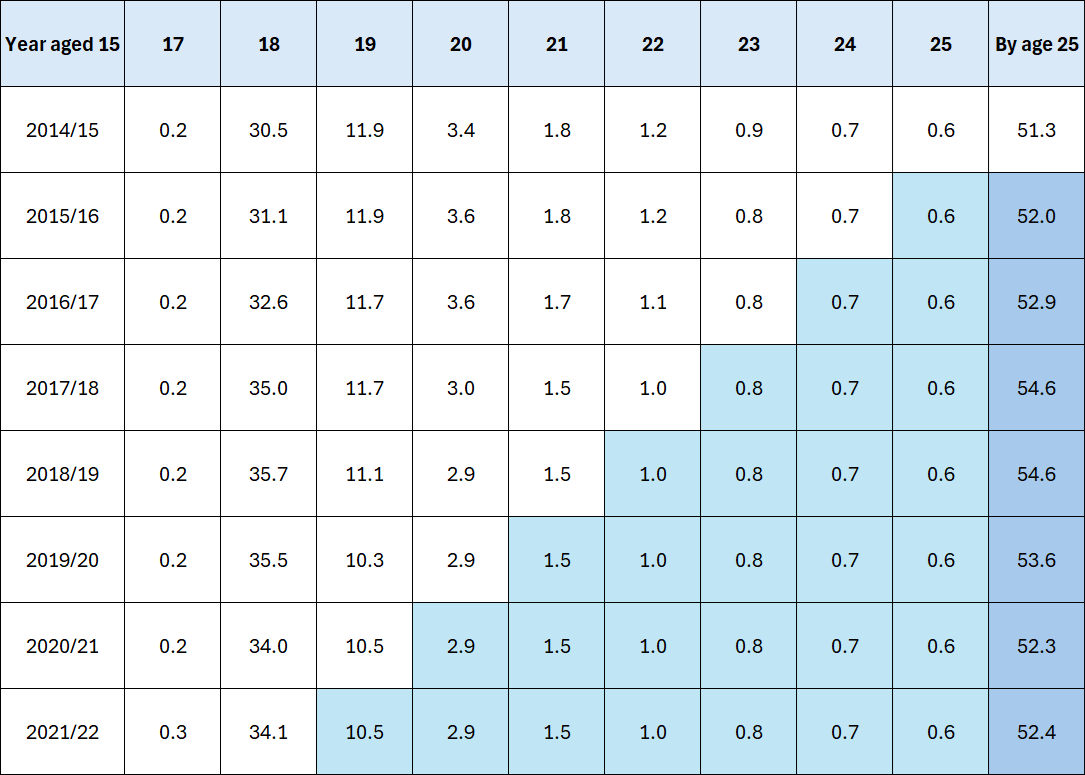
Whilst the projection will be less accurate further into the future (as it is based on fewer years of data), it provides a useful estimate of anticipated future trends.
Note that the projections are entirely based on historic data and do not take account of any future changes in Government policy or behaviour change
Participation in Higher Education (Level 4 and above)
The chart below shows the historic and projected estimates for cohorts up to 15-year-olds in 2021/22. The most recent cohort of actual data relates to 2014/15. The projection for the latest cohort is based on the participation rate by age 18 in 2024/25 plus the last known initial entry rate for older ages.
The chart shows a continued increasing trend from the actual figure of 51.3% for the 2014/15 cohort, before peaking during the Covid pandemic at 54.6% and then falling back down before settling at just over 52% for the latest cohorts.
This means that we are likely to see the actual participation rate by age 25 continue to increase for the next few cohorts before falling back to levels seen immediately prior to the pandemic.
Participation at level 4/5
Note that entrants to level 4 and 5 qualifications tend to be older than those who enter qualifications at level 6 and above. Therefore projecting future participation rates is subject to a larger margin of error, particularly for the later cohorts that rely on participation at the youngest ages
The chart below shows the historic and projected estimates for cohorts up to 15-year-olds in 2021/22. The most recent cohort of actual data relates to 2014/15. The projection for the latest cohort is based on the participation rate by age 18 in 2024/25 plus the last known initial entry rate for older ages.
The chart shows a decreasing trend from the actual figure of 5.5% for the 2014/15 cohort until the 2018/19 cohort. The rate then remains around 5.0% for the most recent cohorts.
Contact us
If you have a specific enquiry about Widening participation in higher education statistics and data:
Widening participation statistics
Email: HE.statistics@education.gov.ukContact name: John Simes
Press office
If you have a media enquiry:
Telephone: 020 7783 8300
Public enquiries
If you have a general enquiry about the Department for Education (DfE) or education:
Phone: 0370 000 2288
Opening times
Monday to Friday from 9.30am to 5.30pm (closed on bank holidays)