Methodology

Widening participation in higher education

Published

New Expanded Release

This is the first release to include statistics previously published in the Participation Measures in Higher Education series

The merge has taken place to expand reporting previously published across the two separate series, but also to bring data on higher education participation into one place and allow more timely publication

The publication is expanded to include detailed breakdowns by pupil, school and study characteristics for ages 18, 19, 20, 25 and 30 in addition to the overall participation rate by individual ages. 

The main release now focuses on a summary of the key data on participation by age 19 and by age 25, with participation by other ages available in the Explore and download data section of the release.

There have been some small changes to the methodology of the release. More details are available in the Changes in 2024/25 section below.

New Data Dashboard

A new interactive dashboard (opens in new tab) has been developed to bring all the additional data in the publication together in a concise, accessible and engaging format.

The dashboard includes interactive charts and maps of participation rates by age 19 and 25 by tariff group and the full range of characteristics included in the publication.

Participation in Higher Education by Pupil and Study Characteristics

This publication presents annual statistics on widening participation in higher education (HE) for pupils who attended English state-funded and special schools, broken down by pupil, school and study characteristics.

Pupil characteristics presented include Free School Meal eligibility, disadvantage status, sex, ethnicity, first language, Special Educational Need (SEN) provision, Looked After Children, Children in Need, Care Leavers and POLAR quintile. Figures are also presented for A level students by type of school attended.

HE study characteristics include level of study, qualification group and mode of study.

The measures are calculated using matched data. This matches the National Pupil Database to the Individualised Learner Record (ILR) and the Higher Education Statistics Agency (HESA) Student Record. This allows pupils to be tracked from English schools at age 15 to higher education (HE) at older ages. 

The measures cover HE courses at UK Higher Education Institutions, Alternative Providers and English Further Education Colleges. 

All charts and tables reference the academic year in which a cohort was aged 15. Detailed breakdowns are provided for ages 18, 19, 20, 25 and 30 in addition to the overall participation rate by individual ages. 

The latest year of HE participation data is from the academic year 2024/25. The latest cohorts included in the release for each Higher Education entry age are set out in the table below.

HE Entry Age

Latest cohort of 15 year olds

17

2022/23

18

2021/22

19

2020/21

20

2019/20

21

2018/19

22

2017/18

23

2016/17

24

2015/16

25

2014/15

26

2013/14

27

2012/13

28

2011/12

29

2010/11

30

2009/10

Figures are presented from the earliest point we have consistent and reliable data for each characteristic. Most of the statistics in the release relate to cohorts from 2005/06 onwards, however for Free School Meal pupils we are able to present figures from 2001/02 onwards. This means we can currently track HE participation up to age 38.

Caveats 

  1. Prior attainment is not accounted for in these measures. Many pupils will not continue their education; therefore will not hold the qualifications to progress to HE
  2. Due to the matching procedures deployed, all figures in these measures should be treated as estimates

Free School Meal Eligibility

Children in state-funded schools in England are entitled to receive free school meals if a parent or carer were in receipt of any of the following benefits:

  • Income Support
  • Income-based Jobseekers Allowance
  • Income-related Employment and Support Allowance
  • Support under Part VI of the Immigration and Asylum Act 1999
  • the guaranteed element of State Pension Credit
  • Child Tax Credit (provided they were not also entitled to Working Tax Credit and had an annual gross income of no more than £16,190, as assessed by Her Majesty’s Revenue and Customs)
  • Working Tax Credit run-on - paid for 4 weeks after you stop qualifying for Working Tax Credit
  • Universal Credit - if you apply on or after 1 April 2018 your household income must be less than £7,400 a year (after tax and not including any benefits)

Pupils in families with no recourse to public funds (NPRF) can also be eligible for free school meals – see here for further information: Providing free school meals to families with no recourse to public funds (NRPF) - GOV.UK (www.gov.uk)  (opens in new tab)

Pupils are still eligible for free school meals in school in sixth form, but not sixth form college or further education.

Since 1 April 2018, transitional protections have been in place which will continue during the roll out of Universal Credit. This has meant that pupils eligible for free school meals on or after 1 April 2018 retain their free school meals eligibility even if their circumstances change. Prior to the pandemic, this had been the main driver in the increase in the proportion of pupils eligible for free school meals as pupils continue to become eligible but fewer pupils stop being eligible.

Any pupil gaining eligibility for free school meals after 1 April 2018 will be protected against losing free school meals until March 2025. After March 2025, any existing claimants that no longer meet the eligibility criteria at that point (because they are earning above the threshold or are no longer a recipient of Universal Credit) will continue to receive free school meals until the end of their current phase of education (i.e. primary or secondary).

In June 2024, the government announced that Free School Meal entitlements will expand from the 2026/27 academic year. This release refers to the January 2026 school census, therefore presented statistics do not reflect the new eligibility arrangements. Further details on the policy are available at:  Free school meals: guidance for local authorities, local-authority-maintained schools, academies and free schools - GOV.UK (opens in new tab).

The proportion of pupils eligible for (and claiming) Free School Meals (FSM) can change over time depending on economic factors affecting employment and earnings and any changes to eligibility criteria. This means that in some years, when the proportion of pupils eligible for FSM is lower, the cohort eligible for FSM can be relatively more disadvantaged compared to All Other Pupils than in other years.

The table below shows how the proportion of pupils eligible for FSM has changed over time. 

Proportion of pupils eligible for Free School Meals by year aged 15

Academic YearPercentage of Pupils Eligible for Free School Meals
2001/02

14.4%

2002/03

14.1%

2003/04

14.0%

2004/05

13.8%

2005/06

13.2%

2006/07

12.9%

2007/08

12.5%

2008/09

12.9%

2009/10

13.4%

2010/11

14.0%

2011/12

14.3%

2012/13

14.9%

2013/14

14.5%

2014/15

13.9%

2015/16

13.4%

2016/17

13.2%

2017/18

12.7%

2018/19

14.1%

2019/20

15.8%

2020/21

18.8%

2021/22

20.8%

2022/23

22.7%

The increase in the proportion eligible for FSM in recent years has been driven by the transitional protections in place during the roll out of Universal Credit, which has meant those eligible for FSM retain their eligibility even if their circumstances change.  

In 2022/23, 22.7% were eligible for Free School Meals at age 15, the highest in the series. It could therefore be argued that the 2022/23 cohort is relatively less disadvantaged than previous cohorts and we might expect, all other things being equal, that they would therefore have more chance of progressing to HE than previous cohorts.

Caveats

  1. There may be pupils who are eligible for FSM but do not claim for a number of reasons. Such pupils will not be classified as eligible for FSM for the purposes of this measure.
  2. Pupils may have been eligible for FSM in earlier school years, but not when aged 15. Such pupils will not be recorded as eligible for FSM in this measure.

Definitions of Characteristic Variables

This section provides definitions of the variables and breakdowns used in the main publication and dashboard.
 

BreakdownDescription
Care LeaversA care leaver is defined as a young person looked after for at least 13 weeks following their 14th birthday, including some time after their 16th birthday, who ceased to be looked after and turned 17 to 25 in the reporting year (to 31st March).

This publication presents figures for state-funded and special school pupils who were 15 at the start of the academic year who were later known to be care leavers at age 19.  Information provided for 17-21 year olds relates to contact around their birthday in the reporting year. Figures for care leavers are rounded to the nearest whole number.

Data is not currently available for the care leavers for the latest cohort
Children in Need

A child in need is defined under the Children Act 1989 as a child who is unlikely to reach or maintain a satisfactory level of health or development, or their health or development will be significantly impaired without the provision of services, or the child is disabled. 

This publication presents figures for Children in Need at 31st March for state-funded and special school pupils who were 15 at the start of the academic year. 

Note that Looked After Children are a subset of Children in Need. Figures for Children in Need are rounded to the nearest whole number.

Looked After Children

A child is looked after by a local authority under the Children Act 1989 if they fall into one of the following: is provided with accommodation, for a continuous period of more than 24 hours [Children Act 1989, Section 20 & 21]; is subject to a care order [Children Act 1989, Part IV]; or is subject to a placement order. 

This publication presents figures for Children looked after continuously for 12 months or more at 31st March for state-funded and special school pupils who were 15 at the start of the academic year.

Note that Looked After Children are a subset of Children in Need. Figures for Looked After Children are rounded to the nearest whole number.

Ethnic GroupBroad ethnic group, aligned to Government Statistical Service (GSS) standards. The Asian/Asian British ethnic group includes Chinese pupils.
First LanguageA pupil is recorded to have a first language other than English if they are exposed to a language at home that is known or believed to be other than English.
Free School Meals

Eligibility for Free School Meals (FSM) at age 15

The proportion of pupils eligible for Free School Meals (FSM) changes over time, which can affect the comparability of the figures.

Disadvantage

A pupil is defined as disadvantaged if they were eligible for Free School Meals (FSM) at age 15 or at any point in the previous six years

The proportion of disadvantaged pupils changes over time, which can affect the comparability of the figures.

POLAR

Participation of Local Areas (POLAR) was produced by the Office for Students (OfS) and classifies small areas across the UK into five groups according to their level of young participation in HE. Each of these groups represents around 20 per cent of young people and are ranked from quintile 1 (Q1) (areas with the lowest young participation rates, considered as the most disadvantaged) to quintile 5 (Q5) (highest young participation rates, considered most advantaged).

Participation of Local Areas (POLAR) has been updated over the years to POLAR2, POLAR3 and POLAR4. This publication presents information using POLAR4.

Sex

Relates to the sex of a person as recognised in law.

Historical use of the word gender in data collections may have meant that gender identity was reported in some cases, as opposed to legal sex. While this is unlikely to have a significant effect on overall figures, it may affect figures in more granular subdivisions. The definitions used in the data collection relating to this publication will be revised in due course and time series that contain sex as a category may be affected.

Special Educational Needs

A child or young person has SEN if they have a learning difficulty or disability which calls for special educational provision to be made for him or her.

From 2015, the School Action and School Action Plus categories were combined to form one category of SEN support. Extra or different help is given from that provided as part of the school's usual curriculum. The class teacher and special educational needs co-ordinator (SENCO) may receive advice or support from outside specialists. The pupil does not have an Education, Health and Care (EHC) plan or Statement of SEN.

A pupil has an EHC plan or Statement of SEN when a formal assessment has been made with a document in place setting out the child's needs and the extra help they should receive. Children with an EHC plan have more complex needs than those receiving SEN support. For further details on these definitions see Children with special educational needs and disabilities (SEND)

Level of study

Level of study refers to the first qualification at level 4 or above that the individual was aiming to achieve when they set out in their studies.

The level of the qualification relates to the level in the year in which it was taken. This publication covers the period when the qualifications framework changed from the National Qualifications Framework (NQF) to the Qualifications and Credit Framework (QCF) and then the Regulated Qualifications Framework (RQF).  This means that some qualifications will have changed level over time.

These figures refer to the first time a pupil participates in HE level study. A pupil may return to HE level study in a future academic year and participate in a different qualification aim, level or mode of study compared to their original qualification.

Only the years relating to the 15-year-old cohorts from 2004/05 onwards, for which we have complete and consistent breakdowns, have been published.

Prior to 2013/14, a large number of qualifications in the ILR were not categorised at a specific level. In these cases, the level of the qualification has been determined based on the qualification type, as is done in the case of HESA data.

For the remaining qualifications where the qualification type doesn’t align to a single level, we take the most recent recorded level for that qualification (where the qualification continued to exist in 2013/14 or later). These steps significantly reduce the number of qualifications where the specific level is unknown, however a small number remain. 

Qualification level is only available on a consistent basis in the HESA data for qualifications undertaken from 2007/08 onwards. Therefore, we only present figures by level of study for 2004/05 cohort of 15-year-olds onwards.

For apprenticeships, we take a different approach as an apprenticeship programme can contain multiple component aims, which make up part of the overarching apprenticeship framework or standard. For this publication, if a component aim has a higher level than that of the overarching programme aim, then the component aim level is preferred to the programme aim level.

Mode of study

Mode of study refers to whether a student has undertaken full-time or part-time higher education.

These figures refer to the first time a pupil participates in HE level study. A pupil may return to HE level study in a future academic year and participate in a different qualification aim, level or mode of study compared to their original qualification.

Figures for apprenticeships are presented separately.

Qualification Group

Qualification group refers to the first qualification that the individual was aiming to achieve when they set out in their studies.

These figures refer to the first time a pupil participates in HE level study. A pupil may return to HE level study in a future academic year and participate in a different qualification aim, level or mode of study compared to their original qualification.

Figures for apprenticeships are presented separately.

School Type

School type refers to the type of school attended at age 17 where students took their A levels.

There has been continued reform to KS5 qualifications and methodological changes in the way the KS5 cohort is counted. It is not possible to directly compare figures for HE progression rates from 2013/14 with earlier years and further changes in recent year have added further volatility to the time series.

From 2013/14 the cohort includes students who took a single AS level (as well as those combining one AS level with vocational qualifications). We would expect these students to have lower progression rates than in the past when the threshold for inclusion in school performance measures was at least one A level. The change has most impact on the state-funded students, who are more likely to study AS levels.

While the rest of the publication relates specifically to students in state-funded schools, the school type breakdown includes estimates for independent schools.

Prior attainment is not accounted for in this measure. Many pupils may not achieve the required Level 3 qualifications to progress to HE.

State schools/colleges include the following school types for this measure:

Academy – Converter, Academy – Special, Academy – Sponsor Led, City Technology College, Community, Community special, Converter Special Academy, Foundation, Foundation special, Free School – 16-19, Free School – mainstream, Free School – Studio School, Free School – UTC, Further Education, Special Free School, Voluntary aided, Voluntary controlled

Independent schools include the following school types:

Non-maintained special, Independent, Independent special, Independent School approved to take pupils with Special Educational Needs

HE Provider Tariff Groupings

Providers have been grouped into low, medium and high tariff providers based on the mean tariff score of their intake.

The cohort used for the calculation is English domiciled full-time first year entrants to undergraduate courses at UK Higher Education Providers who are aged under 21. The providers relate to those providing returns to the HESA Student Record and Alternative Provider Record.

The calculation of mean tariff is based on the total UCAS tariff points of the cohort across all their qualifications, where each individual points score is capped at the equivalent of three A* grades at A level. 

The UCAS points used in the calculation for the current year are shown below for A level grades:

A Level GradeUCAS points
A*

56

A

48

B

40

C

32

D

24

E

16

The maximum score achieved by entrants is therefore set to 168 UCAS points (3 A levels at A* or equivalent). The calculation is carried out for each individual year, with the tariff points used relating to those that were in place at the time. The maximum tariff score was 360 UCAS points until 2010/11 when the A* grade was introduced, which increased the maximum score to 420 UCAS points. The present tariff points scores have been in place since 2017/18. 

Only entrants with UCAS tariff points recorded are included in the calculation. 

Once the mean tariff score is calculated for each provider, they are ranked and then allocated to low, medium and high tariff groupings with each forming roughly a third of the student cohort. Given the calculation is carried out each year, providers may change tariff groupings over time.

Although all providers are included in the calculation of low, medium and high tariff, we suppress the provider level data for the smallest providers, where the figures are likely to be volatile and less representative of the provider as a whole. Data for providers is suppressed where the number of students included in the calculation is below 23 or where there are fewer than 50% of the cohort with tariffable qualifications.

For this publication we focus on high tariff providers but breakdowns by low, medium and high tariff groupings may be included in future publications. We will continue to update the groupings as new data becomes available.

More details on tariff points are available on the UCAS website:

UCAS undergraduate tariff points (opens in new tab)

The measure is not intended to be used to rank providers based on their selectivity or to judge their quality. In particular, some providers, such as those specialising in single subjects such as music and drama, are less likely to rely on UCAS tariff points for entry than more general providers. Judging selectivity based on UCAS tariff points alone is therefore likely to give a false impression. In addition, some of the more diverse providers are likely to be selective for some subjects and not others and this would be hidden by a measure covering the whole provider.

It should also be noted that the measure is based on English entrants aged under 21. The measure may therefore be less representative of providers where they have a large proportion of non-English domiciled students and/or older students.

This publication relates to progression to HE for students who attended English schools and colleges. Given the coverage differs from that used to identify the tariff scores, we would not expect to see a third of students who attended English schools and colleges in each tariff group.

Given the calculation is carried out each year, providers may move in and out of the high tariff grouping over time. This can lead to volatile high tariff progression rates at regional and local authority level if a large local provider moves between tariff groups. 

Changes to how tariff groups are used in the publication

The publication has been expanded to include additional age groups in addition to figures by age 19. Previously, students were allocated to the tariff group of the provider they attended at age 19. However, now that we have expanded the publication to cover other ages, students are allocated to the tariff group of the provider based on year of entry.

The table below shows how this has affected the high tariff participation rate by age 19 compared to the previous method.

Academic Year
(age 15)

New Method
(tariff on entry)

Old Method
(tariff at age 19)

Difference

2008/09

9.8

9.2

0.6

2009/10

10.2

10

0.2

2010/11

11

11.3

-0.3

2011/12

11.5

11

0.5

2012/13

11.6

11.4

0.2

2013/14

11.9

12

-0.1

2014/15

12.1

11.8

0.3

2015/16

12.2

12.4

-0.2

2016/17

12.5

12.1

0.4

2017/18

13.7

13

0.7

2018/19

14

15.3

-1.3

2019/20

13.2

12.8

0.4

The two series show similar trends, although the new method has a smoother trend. The biggest differences relate to the time around the Covid pandemic when there was an expansion in the number of students entering high tariff providers. Whilst this increase is still apparent under the new methodology, it is less pronounced.

Projecting Future HE Participation

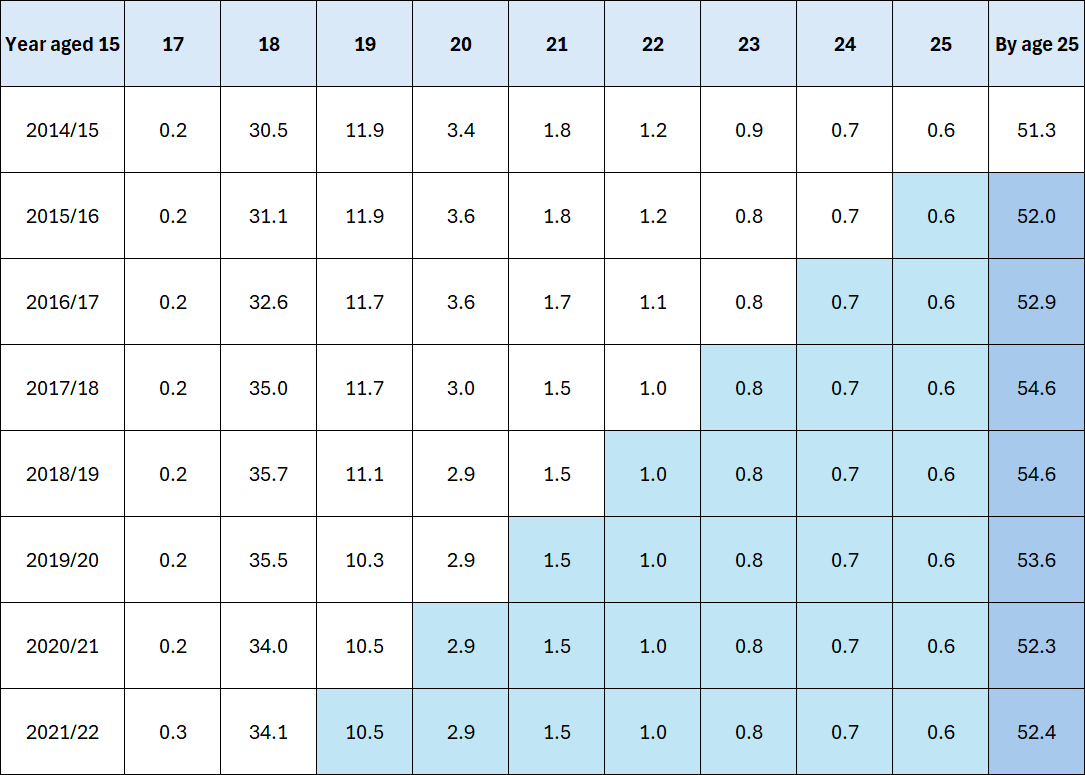
The vast majority of HE entry relates to 18 and 19 year olds. We can therefore project HE participation by age 25 up to seven years ahead of the latest age 25 cohort (2014/15) with a certain degree of reliability.

To do this we take the latest known initial participation rate by age and assume the rates remain at the same level for the later cohorts. This is illustrated in the table below where the white cells are actual rates and the blue cells estimated.

Illustration of calculation of projected participation by age 25 

Table illustrating the calculation of the projected HE participation rate by age 25

Whilst the projection will be less accurate further into the future (as it is based on fewer years of data), it provides a useful estimate of anticipated future trends. 

Note that the projections are entirely based on historic data and do not take account of any future changes in Government policy or behaviour change

Matching Process

The National Pupil Database (NPD) contains administrative data on all pupils in schools in England, collected by the Department for Education. Key Stage 5 (KS5) data and Pupil Level Annual School Census (PLASC) records were matched to the Higher Education Statistics Agency’s (HESA) Student Record and Alternative Provider Student Record, and the Individualised Learner Record (ILR).

The matching process allows for school pupils to be tracked through to Higher Education. The match achieved is called a “fuzzy match” where we rely on names, postcodes, dates of birth, etc and there is some potential for minor errors in the matching process. For this reason, the figures are deemed estimates due to the reliability of the matching procedure used.

Changes over time

The publication includes a very long run of data, dating back to 2001/02. The matching process has changed over time, which may have some impact on match rates and comparisons over time.

Our analysis suggests that there are specific years that are more affected by changes in the matching than others:

  • The match to HESA data did not include 16 and 17-year-olds prior to 2014/15
  • The filters used to remove under 18s from the HESA data in 2008/09 were incorrectly applied, which led to a small number of 17-year-olds being matched and some 18-year-olds not being included in the match in that year. For 18-year-olds this is likely to have reduced the number being matched by up to around 10%, although the vast majority will have participated in HE at age 19 in 2009/10 and so the impact on cohort measures will be limited. This is evident in the unusually low participation rate by age 18 for the 2005/06 cohort of 15-year-olds. For 17-year-olds the numbers are very small and so the key measures used are not affected, however it has caused a large proportional increase in the number entering HE at age 17 in 2008/09
  • Changes in the matching methodology in 2018 have led to an increase in the number of HE entrants that matched to a school census record for HE entry from 2017/18 onwards where they were categorised in their HE records as not being domiciled in England immediately prior to study. We believe the numbers involved are relatively small but will have some impact on comparisons between figures looking at HE entry in 2016/17 and later years
  • The matching methodology was revised again in 2024. Every effort has been made to have consistency with the match carried out in previous years, however it is likely that the change in matching has had some impact on outputs. We believe any impact on the numbers in this publication is very small but it may affect comparisons between the 2012/13 cohort of 15-year-olds and earlier cohorts for small groups in particular
     

Changes in 2024/25

New Expanded Release

This is the first release to include statistics previously published in the Participation Measures in Higher Education series. The merge has taken place to expand reporting previously published across the two separate series, but also to bring data on higher education participation into one place and allow more timely publication.

There have been some small changes to the methodology and content of the release. More information is set out below.

Release Content

All charts and tables reference the academic year in which a cohort was aged 15. Previously this publication presented data relating the academic year in which a cohort was aged 19.

The main release provides a summary of the key information. The more detailed information covered in previous releases is now included in an interactive dashboard (opens in new tab) with additional breakdowns for ages 19 and 25. The underlying data includes all previously published information with additional breakdowns by age. 

Changes to methodology and impact on historical figures

Some small changes have been made to the source data and methodology used in this publication to align with the Participation Measures in Higher Education release.

We now use slightly different historical data on HE in Further Education Colleges, which is broader in coverage and includes the full age range we are able to match. In addition, the previous methodology looked at participation at ages 18 or 19, whereas the new methodology relates to participation by age 19.

The table below shows that these changes have a small impact of the overall national figures. Differences are likely to be larger when looking at local authority data and figures for smaller groups.

Participation Rate in Higher Education by age 19 - comparison of methods

Academic Year
(age 15)
New MethodOld MethodDifference
2001/02

30.9

30.7

0.2

2002/03

31.5

31.3

0.2

2003/04

31.5

31.4

0.1

2004/05

32.6

32.5

0.1

2005/06

33.9

33.9

0

2006/07

35.2

35.1

0.1

2007/08

36

36

0

2008/09

36.6

36.6

0

2009/10

36.9

36.8

0.1

2010/11

39

39.2

-0.2

2011/12

40.8

40.7

0.1

2012/13

41.3

41.2

0.1

2013/14

42.3

42.2

0.1

2014/15

42.6

42.5

0.1

2015/16

43.2

43.1

0.1

2016/17

44.5

44.4

0.1

2017/18

46.9

46.8

0.1

2018/19

47

46.9

0.1

2019/20

46

45.8

0.2

High Tariff Participation

Tariff groups are now based on the year of entry whereas previously they related to the year the student was aged 19. See the HE Provider Tariff Groupings section for more detail on the impact of this change.

Changes in 2023/24

Care Leavers

Figures on progression to higher education for care leavers are included for the first time.

Local authorities provide information about eligible young people who had ceased to be looked after, who turned 17 to 25 in the reporting year (to 31st March).

These eligible young people were looked after for at least 13 weeks following their 14th birthday, including some time after their 16th birthday. Information provided for 17-21 year olds relates to contact around their birthday in the reporting year.

This publication presents figures for state-funded and special school pupils who were 15 at the start of the academic year who were later known to be care leavers at age 19.

More details on defining care leavers are available in section 2.10.2 of this document:

Children looked-after by LAs in England 2024 to 2025 guide v1.3 (opens in new tab)

Unaccompanied asylum-seeking children

Note that care leavers include unaccompanied asylum-seeking children (UASC). Changes in the number and characteristics of these children over time is likely to affect the comparability of the figures presented. For example, the age composition of UASC has changed over time with only 11% of UASC aged under 16 years in 2024 compared to around a quarter a decade earlier. As this proportion changes, this will affect the composition of care leavers who attended state-funded schools in England and the subsequent higher education progression rates.

Other sources

Note that figures are published on the activity of care leavers as part of this release:

Statistics: looked-after children - GOV.UK (opens in new tab)

This includes statistics on higher education activity by age. 

The figures will be lower than those presented here as:

  1. They look at activity at a single point in time rather than by age 19
  2. They include all care leavers, rather than just those who attended state-funded schools and special schools. Those who attend alternative provision are less likely to progress to higher education than those attending mainstream provision 
  3. The age of the care leaver relates to the end of March, whereas the figures in this publication relate to age at the start of the academic year (and so cover slightly older students, who are more likely to have entered higher education)
  4. The activity relates to contact around the care leaver's birthday and care leavers may be less likely to report their main activity as higher education during holiday periods

Changes in 2022/23

Tariff Groupings

The publication previously used provider tariff groupings produced by HESA. However, HESA no longer produce these groupings and stopped updating them from 2019/20.

The method used for the 2024 publication onwards is a simplified version of the previous HESA methodology. The calculation is now based on the total UCAS tariff points (from all qualifications) for each individual capped at the equivalent of three A* grades at A level. The calculation is now restricted to English domiciled entrants rather than UK domiciled.

The previously used HESA methodology differed in that it built up the tariff points for each individual based on their top three A level or equivalent qualifications before being normalised against the maximum points score (equivalent to three A* grades at A level). The calculation was based on UK domiciled entrants.

In addition, under the previous methodology, providers were allocated to low, medium and high tariff groupings so that each formed roughly a third of students who had tariff points recorded. The updated methodology instead uses the full cohort of students to allocate providers to tariff groups. This ensures that the likelihood of an individual progressing to a high tariff provider is more consistent over time.

The 2024 methodology update has had a small impact on the mean tariff scores of the vast majority of institutions but does lead to some providers changing tariff groups.

However, the measure is more stable because we now restrict to English domiciled entrants rather than UK domiciled, which provides closer alignment with the cohort of pupils in English schools and colleges used as the basis of this publication.

Restricting to English domiciled students increases the progression rates compared to UK domiciled. This is because non-English HE providers have less weight in the calculation and English school and college students are more likely to attend English HE providers than non-English providers.

Note the calculation is carried out for entrants in each individual year and so providers may change between groupings year on year

Impact of changes

The tables below compare the high tariff progression rates for the old HESA method against the new method. 

The old method was based on UK domiciled entrants and the new method is restricted to English domiciled. In order to allow a direct comparison of the impact of the methodology change, a UK domiciled version of the new method is shown to give the closest possible comparison to the old method. Note, however, that this publication uses the English domiciled version for tariff groupings.

Note that the old HESA method hasn't been updated since 2019/20, hence the figures for 2020/21 onwards relate to the provider groupings calculated in 2019/20

The table below shows the high tariff progression rates for state-funded pupils at age 15 under each of the methods.

The new method gives similar high tariff progression rates in most years from 2011/12 to 2019/20 when looking at UK domiciled entrants. For 2020/21 onwards, the old method figures relate to the provider groupings calculated in 2019/20 and so this doesn't provide a direct comparison of the impact of the methodology change.

When we restrict to English domiciled entrants (as used for this publication) we see a greater increase in high tariff progression rates in the most recent years.

High tariff progression rates for state-funded pupils - comparison of methods

Academic Year

New Method - English Domiciled

New Method - UK Domiciled

Old Method - UK Domiciled

2009/10

9.8%

9.8%

8.4%

2010/11

9.8%

9.4%

8.6%

2011/12

10.3%

9.8%

9.6%

2012/13

9.2%

9.0%

8.6%

2013/14

10.0%

9.8%

9.0%

2014/15

11.3%

10.7%

10.2%

2015/16

11.0%

10.4%

10.2%

2016/17

11.4%

10.8%

9.7%

2017/18

12.0%

10.7%

10.1%

2018/19

11.8%

10.6%

10.9%

2019/20

12.4%

10.6%

10.9%

2020/21

12.1%

10.3%

11.4%

2021/22

13.0%

11.6%

13.4%

2022/23

15.3%

13.6%

14.0%

The table below shows the high tariff progression rates for Key State 5 students at age 17 under each of the methods.

We see a similar pattern to that seen for state-funded pupils with the new method giving similar high tariff progression rates in most years from 2011/12 to 2019/20 when looking at UK domiciled entrants. Again for 2020/21 onwards, the old method figures relate to the provider groupings calculated in 2019/20 and so this doesn't provide a direct comparison of the impact of the methodology change.

When we restrict to English domiciled entrants we see a greater increase in high tariff progression rates in the most recent years.

High tariff progression rates for KS5 students - comparison of methods

Academic Year

New Method - English Domiciled

New Method - UK Domiciled

Old Method - UK Domiciled

2009/10

28.1%

28.2%

24.6%

2010/11

26.5%

25.6%

23.8%

2011/12

25.7%

24.7%

24.1%

2012/13

22.3%

22.0%

21.1%

2013/14

23.1%

22.6%

21.1%

2014/15

24.2%

23.2%

22.3%

2015/16

22.9%

21.9%

21.5%

2016/17

23.7%

22.6%

20.7%

2017/18

25.2%

23.0%

21.9%

2018/19

24.7%

22.6%

23.1%

2019/20

30.0%

26.7%

27.2%

2020/21

28.6%

25.3%

27.1%

2021/22

29.7%

26.7%

30.3%

2022/23

33.8%

31.0%

31.3%

Changes to matching methodology

The methodology used to match the National Pupil Database (NPD) to the Higher Education Statistics Agency’s (HESA) Student Record and the Individualised Learner Record (ILR) has been revised.

Whilst every effort has been made to have consistency with the match carried out in previous years, it is likely that the change in matching has had some impact on outputs. We believe any impact on the numbers in this publication is very small but it may affect comparisons between 2022/23 and earlier years for small groups in particular.

Ethnicity

The ethnic groups have been revised to align with GSS standards. The main change from previous releases is that the Chinese ethnic group is contained within Asian / Asian British. In addition the names of some ethnic groups have been amended.

Sex and gender

From the 2023/24 academic year, the gender data item in the School Census has been replaced by a new sex data item.

Data is collected on sex (a value which identifies the sex of a person as recognised in law) on a mandatory basis and schools are required to record it as ‘F’ female or ‘M’ male except for rare instances where the legal sex of a pupil cannot be established by the school. 

For publication purposes the historical gender variable and the new sex variable will be conflated into a single time series under the sex heading.

Historical use of the word “gender” in data collections may have meant that “gender identity” was reported in some cases, as opposed to legal sex.

While this is unlikely to have a significant effect on overall figures, it may affect figures in more granular subdivisions. The definitions used in the data collection relating to this publication will be revised in due course and time series that contain sex as a category may be affected.

TEF

The section on the Teaching Excellence and Student Outcomes Framework (TEF) is no longer included in the publication following consultation on its removal.

Provider details

Provider names and their UK Provider Reference Number (UKPRN) are now sourced from the All Providers Enhanced file published by HESA to ensure consistent naming over time:

HESA - Experts in higher education data and analysis (opens in new tab)
Changes in 2021/22

Disadvantage

The publication now includes an additional section showing progression rates by disadvantage status.

Pupils are defined as disadvantaged if they were eligible for Free School Meals at age 15 or at any point in the previous six years.

Tariff groups

The publication previously used provider tariff groupings produced by HESA. However, HESA no longer produce these groupings. The Department is considering different options for the groupings going forward but in the short term are continuing to use the 2019/20 groupings for 2020/21 and 2021/22 analysis this year. 

Changes in 2020/21

The publication previously used provider tariff groupings produced by HESA. However, HESA no longer produce these groupings. The Department is considering different options for the groupings going forward but in the short term have decided to use the 2019/20 groupings for 2020/21 analysis this year. 

Changes in 2019/20

Changes to KS5 Figures

The HE progression figures now include HE in Further Education colleges for all years in order to give a fuller picture of progression to HE across all provision types.

The table below shows the impact on HE progression rates of including FE colleges for A level students by KS5 school type. 

Change in HE Progression rates for A level students due to inclusion of HE in FE colleges (Percentage Points)

TotalIndependentOther StateSelective StateTotal
2010/110.41.40.41.2
2011/120.41.50.51.3
2012/130.52.00.71.7
2013/140.62.20.81.9
2014/150.62.10.81.8
2015/160.51.90.71.6
2016/170.52.01.01.8
2017/180.72.11.21.9
2018/190.62.01.41.8
2019/200.62.01.51.8

The inclusion of HE in FE colleges has most impact on the HE progression rates for A level students who attended non-selective state-funded schools at age 17, increasing progression rates by around 2 percentage points in most years.

For the wider KS5 cohort, progression rates increase by up to 3 percentage points.

The change has a marginal effect on high tariff HE progression rates.

Additional geographic breakdowns

The publication now includes local authority and regional figures by gender, ethnic group and Special Educational Need status.

These can be found in the Explore data and files section at the top of the main release.

Changes in 2018/19

Children in Need

Figures on progression to higher education for Children in Need were included for the first time.

A child in need is defined under the Children Act 1989 as a child who is unlikely to reach or maintain a satisfactory level of health or development, or their health or development will be significantly impaired without the provision of services, or the child is disabled. 

This publication presents figures for Children in Need at 31st March for state-funded and special school pupils who were 15 at the start of the academic year.

More information about Children in Need statistics can be found here:

Children in Need statistics (opens in new tab)

Note that figures are only available on a consistent basis for Children in Need progressing to Higher Education from 2015/16 onwards.

Deduplication

The matching process leads to a small number of duplicates appearing in the data. The method of deduplicating the data was changed to prioritise entry to Higher Education Institutions above Alternative Providers and Alternative Providers above Further Education colleges where a student attended more than one provider in the same year.

The deduplication method was also changed for a small number of pupils where they appear to have two distinct records at an individual school.

These changes were applied to the full time series, which resulted in small changes to some of the statistics presented.

The measures given in the main body of the publication should be considered alongside other statistics on widening participation in Higher Education. 

Some other measures are described in the following section. 

Universities and Colleges Admissions Service (UCAS): End of cycle reports

UCAS releases widening participation data in December each year, including analysis of entry rates by POLAR quintile and FSM eligibility, and entry to higher tariff providers: 

UCAS End of Cycle Reports (opens in new tab)

Destinations of Key Stage 4 and Key Stage 5 pupils

DfE produce destination measures showing the percentage of students progressing to further learning in a school, further education or sixth-form college, apprenticeship, work-based learning provider or higher education provider. The KS4 measure is based on activity at academic age 16 (i.e. the year after the young person finished compulsory schooling). The KS5 measure is based on activity in the year after the young person took their A Level or equivalent qualifications. 

The latest information is available here: 

Key Stage 4 and Key Stage 5 Destinations (opens in new tab)

Main differences between the KS5 destination measures and the progression to HE by school type measure in this Widening Participation in Higher Education (WPHE) publication: 

  • In the past the DfE destinations figures only covered those in the first year after KS5 exams, whilst the WPHE figures focused on those entering HE by age 19. An additional destination measure has now been added which looks at progression in the two years after KS5. This new measure is more comparable with the WPHE figures.
  • Destinations figures cover those entered for A levels or equivalent qualifications at ages 16 to 18 (at the start of the academic year), WPHE figures cover those studying A levels or equivalent qualifications aged 17 at the start of the academic year.
  • Destinations figures cover only those who stayed in the education destination (in this case HE) for at least the first two terms, WPHE covers all entrants except those who dropped out in the first two weeks.

Participation in education, training and employment age 16-21

DfE also publishes Participation in education, training and employment age 16-21 (opens in new tab) statistics on the percentage of 16 to 21-year-olds participating in education and apprenticeships. This includes estimates for those participating in Higher Education. The figures presented differ from those in this release as they are a snapshot at the end of the calendar year for each age, rather than participation by a given age.

In addition, the Widening Participation release combines level 4 and higher qualifications in HE providers, FE providers, and apprenticeships in the participation measure. The Participation in Education, Training and Employment publication presents those in FE and apprenticeships separately.

Higher Education Statistics Agency (HESA): Performance Indicators in Higher Education

HESA published Performance Indicators in Higher Education between 2002/03 and 2020/21. The 2020/21 edition was the last in its current form:

HESA Performance Indicators (opens in new tab) 

The Performance Indicators provide information about the proportion of entrants who are from state schools and low participation neighbourhoods as well as previously provided data on young peoples’ socioeconomic class. The indicator for state schools reflects the percentage of young, full-time entrants to first degrees in English Higher Education Institutions who had previously attended a school or college in the state sector. These measures differ from the widening participation measures as they focus on the composition of the HE student population rather than progression rates into HE. 

Help and support

Contact us

If you have a specific enquiry about Widening participation in higher education statistics and data:

Widening participation statistics

Email: HE.statistics@education.gov.uk
Contact name: John Simes

Press office

If you have a media enquiry:

Telephone: 020 7783 8300

Public enquiries

If you have a general enquiry about the Department for Education (DfE) or education:

Phone: 0370 000 2288

Opening times:
Monday to Friday from 9.30am to 5.30pm (closed on bank holidays)