This document provides background information on the T Level results publication. It explains the concepts and methods used to calculate the T Level results and provides an overview of the data sources, coverage, quality, and on how the data is validated and processed.
Provisional T Level results
- Published
- Last updated
See all notes (1)
Updated to accompany the March 2024/25 provisional data
Introduction
Data quality
Data on industry placement completion, core component grade and occupational specialism grade were supplied to the Department by providers and awarding organisations through the Manage T Level results (opens in new tab) service.
As such, the Department is reliant on third party validation and quality assurance of this data at point of entry. Providers and awarding organisations are restricted to enter only valid result options for learners who have previously been registered and assigned an assessment entry, when submitting data. Error reports are generated in line with validation rules (detailed on the Manage T Level results service website (opens in new tab)) following bulk data uploads. The Department carried out checks of the data to assess quality and found no notable issues.
This is the fourth year of results for T Levels and represents the fourth phase of roll out in T Level pathways. In the first year there were three pathways available with a further seven added in year two, a further 6 in year three, and a further 2 in in year four. T Levels have not fully rolled out yet, and inferences made from the data must be done so with caution.
Overall T Level grades are calculated by the Department from core component grades, occupational specialism grades and industry placement completion status, according to rules set below in the Annexes: Overall T Level grades.
Results are provisional, as appeals may still be underway which could result in changes to some individual grades, and some partially achieving students are expected to complete their industry placement during the summer after T Level results day. Students where the core component or occupational specialism result is currently pending are excluded from attainment reporting.
Provisional data for 2021/22 are correct as of 9 August 2022
Provisional data for 2022/23 are correct as of 9 August 2023.
Provisional data for 2023/24 are correct as of 7 August 2024.
Provisional November data for 2023/24 are correct as of 1 November 2024.
Provisional November data for 202425 are correct as of 7 November 2025.
These statistics are updated annually, where provisional data for the previous year is updated to ‘revised’.
In March 2026 a further update was added using data from 7 November, this was labelled Provisional November, which accounted for late industry placement completions and appeals of marking but did not include resits in the third year. This further update was added to provide a better representation of provider performance.
The coverage of these statistics mirrors Ofqual data on T Level Technical Qualification (TQ) results (opens in new tab), which includes data for learners expected to complete their T Level programme in the academic year, who have completed both the core component and occupational specialism. Results may differ slightly due to differences in processing and rounding and the timing of data collection.
Data structure
It is possible for learners to sit the core component assessment up to three times.
For the first cohort of students, reported here as final data for 2021/22, most students entered for the core assessment in summer 2021. Due to the Covid-19 pandemic, Teacher Assessed Grades were used in place of planned assessments. The data presented includes the highest grade achieved for learners who have made more than one attempt at the assessment.
For the second cohort of students, reported here as final data for 2022/23, most students entered for the core assessment in summer 2022, and sat externally assessed exams.
Partial achievement in these data refers to students who attempt both the core component and occupational specialism and achieve one. It also includes students who attempt both the core component and occupational specialism, achieve neither, but complete the Industry Placement.
Temporary flexibilities were introduced for 2020 cohort of learners' industry placements, to recognise the impact of the Covid-19 pandemic.
Whilst data are presented split by sex and T Level subject, the number of male and female learners can be uneven across T Level pathways. For this reason, users should take caution when making comparisons between the pass rates for males and females within or between T Level pathways.
Scheduled revisions to data: 2023/24 results
Updating provisional data
The provisional results published for 2023/24 have been updated to 'revised’ following updates to data for students that started T Levels in 2022/23. This means the data includes late results and reviews of marking, as well as any accepted amendments.
The table below shows revised data and the impact when compared to provisional data based on the new methodology. The comparison is with provisional results from August 2024 results day and not the update in March 2025.
Revised 2023/24 | Grade | Achieved grade (count) | Achieved grade (count) | Achieved grade (%) | Impact of change from provisional to revised |
|---|---|---|---|---|---|
| Provisional data | Revised data | ||||
Overall T Level | Distinction * | 14 | 14 | 0.2 | 0.0 ppt |
| Distinction | 1159 | 1187 | 16 | +0.3 ppt | |
| Merit | 3457 | 3581 | 48.2 | +1.3 ppt | |
| Pass | 1913 | 2026 | 27.2 | +1.3 ppt | |
| Partially achieved | 816 | 606 | 8.2 | -2.9 ppt | |
| Unclassified | 21 | 21 | 0.3 | 0.0 ppt | |
| Total students | 7380 | 7435 | n/a | +0.7 % | |
| Achieving Pass or above | 6543 | 6808 | 91.6 | +2.9 ppt | |
Core component | A* | 17 | 17 | 0.2 | 0.0 ppt |
| A | 238 | 240 | 3.2 | 0.0 ppt | |
| B | 1095 | 1103 | 14.8 | 0.0 ppt | |
| C | 2356 | 2377 | 32 | 0.0 ppt | |
| D | 2411 | 2436 | 32.8 | +0.1 ppt | |
| E | 1135 | 1140 | 15.3 | 0.0 ppt | |
| Unclassified | 128 | 122 | 1.6 | -0.1 ppt | |
Occupational specialism | Distinction | 1447 | 1464 | 19.7 | +0.1 ppt |
| Merit | 3632 | 3680 | 49.5 | +0.3 ppt | |
| Pass | 1784 | 1828 | 24.6 | +0.4 ppt | |
| Unclassified | 517 | 463 | 6.2 | -0.8 ppt | |
Industry placement | Completed | 6879 | 7110 | 95.6 | +2.4 ppt |
| Completed (special considerations) | 141 | 150 | 2 | +0.1 ppt | |
| Not completed | 360 | 175 | 2.4 | -2.5 ppt | |
Scheduled revisions to data: 2022/23 results
Updating provisional data
The provisional results published for 2022/23 have been updated to 'revised’ following updates to data for students that started T Levels in 2021/22. This means the data includes late results and reviews of marking, as well as any accepted amendments.
The table below shows revised data and the impact when compared to provisional data based on the new methodology.
Revised 2022/23 | Grade | Achieved grade (count) | Achieved grade (%) | Impact of change from provisional to revised |
|---|---|---|---|---|
Based on revised data | ||||
Overall T Level | Distinction * | 10 | 0.3 | 0.0 ppt |
| Distinction | 791 | 22.2 | +0.4 ppt | |
| Merit | 1,746 | 49.1 | +2.0 ppt | |
| Pass | 795 | 22.3 | +1.1 ppt | |
| Partially achieved | 205 | 5.8 | -3.4 ppt | |
| Unclassified | 12 | 0.3 | 0.0 ppt | |
| Total students | 3,559 | n/a | +3.2 % | |
| Achieving Pass or above | 3,342 | 93.9 | +3.4 ppt | |
Core component | A* | 15 | 0.4 | 0.0 ppt |
| A | 247 | 6.9 | 0.0 ppt | |
| B | 826 | 23.2 | 0.0 ppt | |
| C | 1,177 | 33.1 | +0.1 ppt | |
| D | 874 | 24.6 | 0.0 ppt | |
| E | 377 | 10.6 | 0.0 ppt | |
| Unclassified | 43 | 1.2 | -0.1 ppt | |
Occupational specialism | Distinction | 800 | 22.5 | +0.2 ppt |
| Merit | 1,819 | 51.1 | +0.6 ppt | |
| Pass | 793 | 22.3 | 0.1 ppt | |
| Unclassified | 147 | 4.1 | -1.0 ppt | |
Industry placement | Completed | 3,412 | 95.9 | +2.5 ppt |
| Completed (special considerations) | 59 | 1.7 | +0.1 ppt | |
| Not completed | 88 | 2.5 | -2.6 ppt | |
Scheduled revisions to data: 2021/22 results
Updating provisional data
The provisional results published for 2021/22 have been updated to 'revised’ following updates to data for students that started T Levels in 2020/21. This means the data includes late results and reviews of marking, as well as any accepted amendments.
The table below shows revised data and the impact when compared to provisional data based on the new methodology.
Revised 2021/22 | Grade | Achieved grade (count) | Achieved grade (%) | Impact of change from provisional to revised |
Based on revised data | ||||
Overall T Level | Distinction * | 28 | 2.8 | 0.0 ppt |
| Distinction | 338 | 34.1 | +0.9 ppt | |
| Merit | 416 | 42.0 | +0.4 ppt | |
| Pass | 181 | 18.3 | -0.2 ppt | |
| Partially achieved | 28 | 2.8 | -1.1 ppt | |
| Unclassified | 0 | 0.0 | 0.0 ppt | |
| Total students | 991 | n/a | 0.0 % | |
| Achieving Pass or above | 963 | 97.2 | +1.1 ppt | |
Core component | A* | 46 | 4.6 | -0.1 ppt |
| A | 156 | 15.7 | 0 ppt | |
| B | 303 | 30.6 | +0.2 ppt | |
| C | 309 | 31.2 | -0.1 ppt | |
| D | 142 | 14.3 | -0.1 ppt | |
| E | 34 | 3.4 | +0.1 ppt | |
| Unclassified | 1 | 0.1 | 0 ppt | |
Occupational specialism | Distinction | 382 | 38.5 | +1.1 ppt |
| Merit | 440 | 44.4 | +0.1 ppt | |
| Pass | 149 | 15 | -0.7 ppt | |
| Unclassified | 20 | 2 | -0.5 ppt | |
Industry placement | Completed | 953 | 96.2 | +0.7 ppt |
| Completed (special considerations) | 24 | 2.4 | +0.1 ppt | |
| Not completed | 14 | 1.4 | -0.8 ppt | |
Attainment methodology from 2022/23
The calculation for T Level results changed in August 2023 to only include students who have attempted both Ofqual accredited components of the T Level (core component and occupational specialism) and so completed the examined elements of the two-year programme.
Previous methodology had included those students who had attempted at least one component (and so could include students who had potentially dropped out after 1 year). The change makes the T Level pass rate data more comparable to A levels, where students are only included if they enter all papers for a particular A level qualification.
A more minor change is to include a small number of students whose sex is unknown (excluded in the first production of these data last year).
Note, for the purposes of calculating attainment in the T Level overall, and the Core and Occupational specialism components, that pending results [Q - pending results] continue to be be excluded from the calculation.
Impact of the methodology change based on 2021/22 provisional data
The combined impact of the changes is shown in the table below, which applies current methodology to provisional data for T Level results in 2021/22 and shows the difference from what was published in the first publication of 'Provisional T Level results on 18th August 2022.
The impact is to reduce the number of students included from 1,029 to 991. The same set of students are reported for the Overall T Level, and for the elements that make up the T Level. There is a larger change in the number of students with core results than the occupational specialism as the core is generally done in the first year and so was more affected by any students dropping out in the second year. The increase in 3 occupational specialism students is a result of including sex unknown.
| Provisional 2021/22 | Overall T Level | Core component | Occupational specialism | Industry placement |
| Number of students (Based on new methodology) | 991 | 991 | 991 | 991 |
| Impact of change (difference) | -38 | -38 | +3 | -38 |
Focusing on those that were assessed in both the core and occupational specialism has the impact of increasing the proportion of students that pass the overall T Level as shown in the table below.
| Provisional 2021/22 | Grade | Achieved grade (count) | Achieved grade (%) | Impact of change from old to new methodology |
Based on new methodology | ||||
Overall T Level | Distinction* | 28 | 2.8 | +0.1 ppt |
| Distinction | 329 | 33.2 | +1.3 ppt | |
| Merit | 412 | 41.6 | +1.8 ppt | |
| Pass | 183 | 18.5 | +0.7 ppt | |
| Partial achievement | 39 | 3.9 | -3.5 ppt | |
| Unclassified | 0 | 0.0 | -0.4 ppt | |
| Total students | 991 | n/a | -3.7% | |
| Achieving Pass or above | 952 | 96.1 | +3.8 ppt | |
Core component | A* | 47 | 4.7 | +0.1 ppt |
| A | 156 | 15.7 | +0.4 ppt | |
| B | 301 | 30.4 | +0.8 ppt | |
| C | 310 | 31.3 | +0.5 ppt | |
| D | 143 | 14.4 | -0.7 ppt | |
| E | 33 | 3.3 | -0.9 ppt | |
| Unclassified | 1 | 0.1 | -0.4 ppt | |
Occupational specialism | Distinction | 371 | 37.4 | 0.0 ppt |
| Merit | 439 | 44.3 | +0.1 ppt | |
| Pass | 156 | 15.7 | -0.1 ppt | |
| Unclassified | 25 | 2.5 | 0.0 ppt | |
Industry placement | Completed | 946 | 95.5 | +3.8 ppt |
| Completed (special considerations) | 23 | 2.3 | +0.1 ppt | |
| Not completed | 22 | 2.2 | -3.8 ppt | |
Student characteristics from March 2025
T Level results from 2024/25 cohort have been broken down by student characteristics. Students have been matched to data held by the department for education that are used in the A level and other 16 to 18 results official statistics. Students are initially matched using unique learner number (ULN) which is common between the two datasets. Where there are duplicate ULNs for different students in the A level and other 16 to 18 results data, awarding organisation exam data is used to select the right student characteristics based on which has a core or occupational specialism result. Student characteristics data was matched to 99.9% of the 2024/25 cohort, although some of these students may have unknown characteristics.
Key stage 4 prior attainment
The department collects key stage 4 attainment for pupils at the end of key stage 4 each year, also from AOs.
Student characteristics at the end of key stage 4
Student characteristics, such as ethnicity and free school meal eligibility are not routinely or consistently collected during post-16. This publication makes use of the characteristic information recorded for a pupil at the end of key stage 4 [1]
Data is broken down by the following student characteristics:
- disadvantage status;
- free school meal (FSM) eligibility;
- ethnicity;
- first language;
- special educational needs (SEN)
- KS4 prior attainment
More information on disadvantaged status at the end of key stage 4 can be found in the Quality and Methodology document for the revised GCSE and equivalent results publication (opens in a new tab) (opens in new tab).
[1] Key stage 4 data, from which student characteristics information is sourced, is compiled by the department from key stage 4 results, school census records and qualification entries and results collected from awarding bodies
Provider breakdowns from March 2025
In March 2026, T Level results are broken down by providers teaching the T Level. The overall T Level grade will be published under the provider where the final T Level was certificated. For example, if a student took the core component at College A but moved to College B and completed the industry placement and occupational specialism, the overall result would be published under College B. Providers were given the opportunity to delay a student’s reporting in the Provisional November data, where a student was resitting components in the third year. Delayed students will be published in revised data published the following August.
Retained and assessed methodology - T Level students
The methodology for calculating retained and assessed is the same as described in the T Level Action Plan: analytical annex (opens in new tab), published alongside the T Level action plan: 2023 to 2024 (opens in new tab).
T Level retained and assessed
The T Level is a two-year programme, and T Level retained and assessed is first measured as provisional data after two years. However, learners can elect to complete the T Level over two or more academic years, and retained and assessed is updated as revised data to reflect any further assessment after three years.
A learner that is assessed on the programme within two academic years (provisional) or three academic years (revised) is considered retained and assessed, and this forms the retained and assessed rate.
Students in scope of the measure
The cohort of learners in scope for retained and assessed (provisional) data in 2024/25 are students who started their T Level in 2023/24. The count of T Level entrants is based on the first compulsory returns of the Individualised Learner Record (ILR) and School Census (SC) for that academic year.
To be identified as a T Level entrant, a learner must have started a learning aim that corresponds to the T Level programme [programme type 31] and in the ILR, is a generic programme aim [learning aim reference ZPROG001] or in the school census with a T Level technical qualification aim.
Learners may be linked to more than one learning aim that fits these criteria. For T Level entrants the following conditions must be met:
- The earliest start date of these learning aims must be between 1st August and 31st July of the relevant academic year.
- The learner must have been enrolled on a T Level for at least the threshold number of days to be eligible for funding (opens in new tab). For T Levels, this is 6 weeks (42 days).
- The learner must be funded as a 16-19 student, or a 19-24 student with an education, health and care plan (EHCP).
- The learner must have a valid Unique Learner Number (ULN).
Students who count as retained and assessed
The Manage T Level Results (MTLR) service determines overall T Level results for all students, and for students in scope of the measure, students who are flagged as having been assessed in the MTLR count as being retained and assessed.
The MTLR data cut used for the retained and assessed measure is the same as that used for reporting attainment in this statistical release (see Data Quality section in methodology for record of freeze dates).
A T level entrant is considered retained and assessed in their T Level if they are flagged as receiving a marked grade (including pending grades) in both their core component and occupational specialism. This does not have to be a pass grade.
Retained and assessed methodology - Comparable study programmes
The methodology for calculating retained and assessed is the same as described in the T Level Action Plan: analytical annex (opens in new tab), published alongside the T Level action plan: 2023 to 2024 (opens in new tab).
Two level 3 study programmes are included to provide suitable comparators to the T Level. These comparator level 3 study programmes are:
• 16-year-old entrants to large (1045 guided learning hours or more) vocational and technical qualifications (VTQs) included in performance tables studied over two years;
• 16-year-old entrants whose study programme included 3 or more A levels and no substantial (325 guided learning hours or more) VTQs studied over two years.
Students in scope of the measure
The definitions for entrants in both comparator study programmes are aligned with the definitions for entrants to the T Level (conditions 1-4 in the methodology for defining T Level students in scope for retained and assessed).
The planned end date for aims in the comparator study programmes must be in the academic year after the student starts, ensuring they are two-year study programmes.
The first comparator study programme is equivalent in size to the T Level and is technical in content. A vocational and technical qualification is either a Tech Level or an Applied General Qualification included in performance tables.
The second comparator study programme is equivalent in size to the T Level, but is academic. A level qualifications are defined by the Learning Aim Reference Service (LARS), using Learning Aim Reference Type codes 0002, 1430, 1431, and 1453. Entrants to three or more A level aims who also enroll in a substantial VTQ (325 guided learning hours or more), are removed from this comparator study programme. This is to only consider a fully academic study programme as a comparator.
Entrants to the comparator study programmes are matched to 16-18 exam records held by the Department. Since the comparator study programmes are two-year programmes, exam data will only be available for entrants who were 16 years old when starting the programme. For this reason, an additional date of birth filter is included to ensure that entrants to the comparator study programmes are of academic age 16 (i.e. for the cohort of students starting study programmes in 2021/22, that they are born between 1st September 2004 and 31st August 2005).
Students who count as retained and assessed
Entrants to comparator study programmes are matched to ‘revised’ 2023/24 exam data held by the Department. This is the exam data that underpins reporting for students in the ‘A level and other 16 to 18 results’ statistical release. In this instance the difference between ‘provisional’ and ‘revised’ exam data is that data has been reviewed by schools and colleges in the 16-18 checking exercise. This could include adding any missing results, supplying information on grade amendments following successful reviews of results, or deferring students who are not yet at the end of 16-18 study.
• For the large VTQ comparable study programme, the entrant must have received a valid grade in any large VTQ included in the 2024 performance tables, even if this is different to the one they started.
• For the three or more A level comparable study programme, the entrant must have received a valid grade in three or more A level exams, even if these are different to the A levels they started.
A valid exam grade is defined as an exam entry that was not withdrawn (code W) or wrongly allocated (code CL) or deleted (code D), and where the grade is not ‘no result’ (code X). This includes ungraded (grade ‘U’) results.
Annexes
Overall T Level grades
T Level Pass (P) refers to students who achieve an E or above on the core component, a Pass or above on the Occupational Specialism and complete the Industry Placement.
T Level Unclassified (U) refers to students who attempt but achieve neither the core component nor occupational specialism and do not complete the Industry Placement.
T Level Partial Achievement (PA) refers to students who attempt both the core component and occupational specialism and achieve at least one but not all of the core component, the occupational specialism, or complete the industry placement.
T Level Pass Rate: refers to the % of students in a cohort who have achieved an E or above on the core component, passed their occupational specialism and met the requirements of the Industry Placement, as a proportion of those who have made an attempt at the core component and occupational specialism.
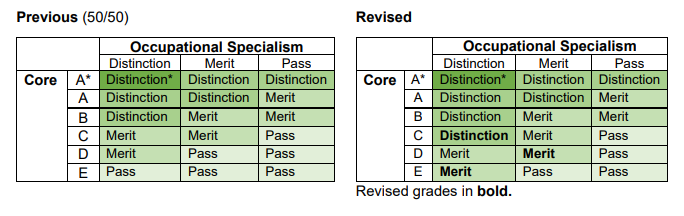
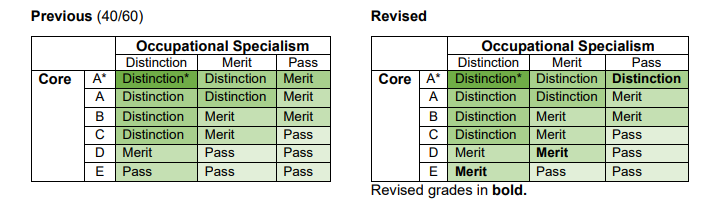
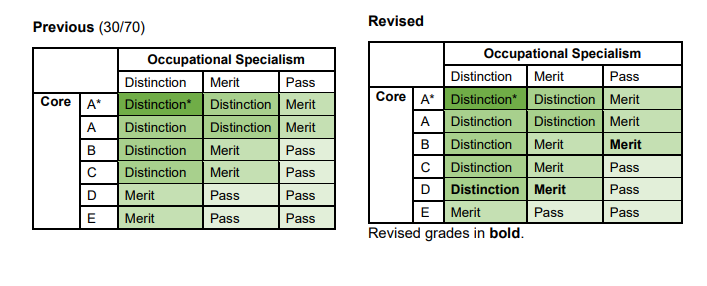
Grading in T Levels since 2022/23
Where a student has met all the requirements of the T Level programme, including completing the Industry Placement, T Level grades are worked out from the students' grades for the Technical Qualification (TQ) Core and Occupational Specialism. These are presented in look-up tables.
Given the size and demand of T Levels, and to ensure students are appropriately recognised for their achievement, in 2022/23 there was a change in how core and occupational specialism grades are aggregated.
Based on the proportions of Guided Learning Hours (GLH) for the Core and Occupational Specialisms (50%/50% or 40%/60% or 30%/70%) one or other lookup tables is used to aggregate grades.
The following table shows which look up table is used for each of the 18 T Level pathways now awarded.
| First awarded | T Level | GLH |
|---|---|---|
| 2021 to 2022 | Design, Surveying and Planning for Construction | 50/50 |
| 2021 to 2022 | Digital Production, Design and Development | 50/50 |
| 2021 to 2022 | Education and Early Years | 40/60 |
| 2022 to 2023 | Building Services Engineering for Construction | 40/60 |
| 2022 to 2023 | Digital Business Services | 50/50 |
| 2022 to 2023 | Digital Support Services | 50/50 |
| 2022 to 2023 | Health | 50/50 |
| 2022 to 2023 | Healthcare Science | 50/50 |
| 2022 to 2023 | Onsite Construction | 40/60 |
| 2022 to 2023 | Science | 40/60 |
| 2023 to 2024 | Accounting | 50/50 |
| 2023 to 2024 | Design and Development for Engineering and Manufacturing | 50/50 |
| 2023 to 2024 | Engineering, Manufacturing, Processing and Control | 50/50 |
| 2023 to 2024 | Finance | 50/50 |
| 2023 to 2024 | Maintenance, Installation and Repair for Engineering and Manufacturing | 50/50 |
| 2023 to 2024 | Management and Administration | 50/50 |
| 2024 to 2025 | Agriculture, Land Management and Production | 30/70 |
| 2024 to 2025 | Legal Services | 50/50 |
The following graphics show how the two look up tables were revised in 2022/23:
Help and support
Contact us
If you have a specific enquiry about Provisional T Level results statistics and data:
16 to 18 Accountability Data and Development team
Email: Attainment.STATISTICS@education.gov.ukContact name: Pat Thomas
Press office
If you have a media enquiry:
Telephone: 020 7783 8300
Public enquiries
If you have a general enquiry about the Department for Education (DfE) or education:
Phone: 0370 000 2288
Opening times:
Monday to Friday from 9.30am to 5.30pm (closed on bank holidays)