Children looked after in England including adoptions
Published
Last updated
See all notes (10)
Corrected reference to the ONS population estimates used in this release
Updated following the release of the 2025 statistical release
Update following release of the 2024 statistical release
Section added on children whose care transfers to another LA. School stability section updated.
Updated following the release of ONS revised population estimates.
Update following release of the 2023 statistical release
Updated with new sections on school stability and and social worker stability.
Update following release of the 2022 statistical release
Clarification of some wording.
Updated with the release of the 2021 statistical release
Summary
This page is a guide to the looked after children statistics published by the Department for Education. It sets out information on:
the collection and coverage of the data
data processing
the quality of the published statistics.
It is updated with each new statistical release. The next revision will be when the ‘Children looked after in England (including adoption)’ statistical release is published in Autumn 2026.
The statistics are based on information on looked after children collected by the Department for Education in the SSDA903 return. This is completed annually by local authorities in England. Data is required for two groups of children:
every child who is looked after by the local authority at any time during the year
care leavers (who are children who have been looked after for at least 13 weeks, which began after they reached the age of 14 and ended after they reached the age of 16, who turn 17 to 25 years old during the year)
History of the collection
The SSDA903 collection began in 1992 and prior to 1998 it covered all looked after children.
Between 1998 and 2003 the SSDA903 return covered a one third sample of children, those with a date of birth divisible by three. There was also an aggregate return, the CLA 100 return, which was used to provide ‘fast track’ data and to gross the sample data.
In 2000, the OC1 (educational qualifications of care leavers) return was introduced, followed by the AD1 (children adopted) returns in 2001 and the OC3 return (19th birthday) in 2002.
From 2004, the CLA100 return was discontinued and the SSDA903 reverted to cover all looked after children. Becoming a web-based data collection for the first time, the SSDA903 return also incorporated the AD1, OC1 and OC3 returns.
Additional information on offending, health promotion checks, immunisations, dental checks, health assessments and substance misuse problem identification and intervention is also collected through the SSDA903. This is collected for children who have been looked after continuously for at least 12 months on 31 March. This information was previously collected via the Outcome Indicators (OC2) return which contained aggregated local authority level data. In the 2008 to 2009 collection this information was added to the SSDA903 and is now routinely collected at child level.
In 2024, information on social worker episodes during the year for any looked after child on 31 March was added to the collection.
A more detailed timeline of changes to the SSDA903 collection is given in Annex A.
Historical revisions to the data
The SSDA903 data is collected in a longitudinal database, with one record for every episode of care. Local authorities update the database every year, including making amendments to previous years’ records where there have been changes.
The SSDA903 collects information about the child - for example sex, date of birth and unique pupil number - and details about the child’s episodes in care. When a change in legal status or placement (or both) occurs, a new episode of care is started and the date and reason for the change are recorded.
Revisions to previously published data occur because of corrections made by local authorities to their historical data. Local authorities can directly amend records for the years since 2004 in the system however most of the changes are made to the previous year's data each year. Common revisions include correcting episode information and including missing records.
The table below gives an indication of how the data for 2024 has changed due to historical revisions between last year’s 2024 publication and the current 2025 publication:
Counts of children looked after in the year ending 31 March 2024, in the 2024 and 2025 statistical releases
Count of children
Reported in 2024 release
Reported in 2025 release
Percentage change
Looked after children on 31 March 2024
83,630
83,530
-0.1%
Children starting to be looked after during the year ending 31 March 2024
33,050
33,130
+0.2%
Children ceasing to be looked after during the year ending 31 March 2024
33,620
33,780
+0.5%
An audit of 2023 to 2024 records which were changed by local authorities in 2025 shows that:
132 child records were deleted
16 child records were added
2,235 master changes were made - these are changes to a child’s date of birth, sex or ethnic group.
A correction to legal status or a date change in any episode of care may mean that the child will no longer be included in a particular set of figures. For example, if a date episode ceased is changed it may mean the child is no longer included in ceased figures for 2024 but is included in ceased figures for 2025 instead. This would mean that the child is counted as looked after on 31 March 2024.
Further information on the data items collected in the SSDA903 return can be found in the collection guide. This and other documents useful for the completion of the SSDA903 return can be found on the DfE children looked after collection website (opens in new tab).
A number of automated data validation checks are carried out at the point of data entry to identify and remove:
invalid codes
unlikely or impossible combinations of legal status
unlikely or impossible sequences of dates
information which contradicts data already held about the child, to maintain consistency with data reported in previous years
information which is contradictory within a return, for example OC2 data reported for a child not looked after for 12 months at the end of the year
Any record which fails the validation checks is highlighted and must be corrected. An explanation of each validation check and guidance on how corrections can be made are documented in the list of validation checks available on the DfE children looked after collection website (opens in new tab).
Some aggregate return level checks are performed in the system to highlight large changes in return level data compared to the previous year. These are there as prompts for local authorities to check their data. Any outstanding aggregate checks need to have explanatory commentary added to the system before the local authority can sign off their return.
Production of snapshot tables
The annual data reported by each local authority is linked (by a unique identifier for each child) to data supplied by the same local authority in previous years (from 1992 onwards).
At the end of the data collection each year a ‘snapshot’ of the database is taken. This includes all the historic data for each child. These snapshot tables are checked to make sure:
they have been produced correctly from the database
the data is consistent between years
sample checks show they accurately reflect the live database
previous years data is consistent with the previous years' snapshot
These snapshot tables are then processed to produce the data for this statistical release.
The Department currently publishes three annual statistical releases:
Children looked after in England (including adoption) (November)
Outcomes for children in need, including children looked after by local authorities in England (March)
Stability measures for children looked after in England (June)
These are accredited official statistics - accredited official statistics are called National Statistics in the ‘Statistics and Registration Service Act 2007’. Further information on accredited official statistics can be found on the Office for Statistics Regulation (opens in new tab) website .
These accredited official statistics were independently reviewed by the Office for Statistics Regulation in February 2015. They comply with the standards of trustworthiness, quality and value in the Code of Practice for Statistics and should be labelled ‘accredited official statistics’.
This can broadly be interpreted to mean that the statistics:
meet identified user needs
are well explained and readily accessible
are produced according to sound methods
are managed impartially and objectively in the public interest
We have continued to align the statistics to the Code of Practice, for example we have:
moved our looked after children releases to the Explore Education Statistics (EES) platform, the new way in which we publish DfE statistics, where we release national and local authority level machine-readable, tidy data format datasets
continued to facilitate local authority user groups annually to discuss changes to the production of these statistics
improved the commentary supporting the statistics, through the introduction of this CLA statistics guide
minimised the number of releases by releasing all information together at the earliest opportunity. For example, in 2018 we released the main publication data altogether (rather than a main/additional table release) and in 2015 we moved the OC2 outcomes to the main publication rather than delaying its release until the later outcomes publication
developed a new outcomes publication, incorporating improvements following user feedback, including improvements to the consistency of definitions and the range of children reported on
added additional breakdowns (for example for characteristics of CLA excluding UASC) to meet user needs.
Our statistical practice is regulated by the Office for Statistics Regulation (OSR). OSR sets the standards of trustworthiness, quality and value in the Code of Practice for Statistics (opens in new tab) that all producers of official statistics should adhere to. You are welcome to contact us directly with any comments about how we meet these standards. Alternatively, you can contact OSR by emailing regulation@statistics.gov.uk or via the OSR website.
Children looked after in England (including adoption) statistical release
The ‘Children looked after in England including adoption’ statistical release provides information - for the year ending 31 March - on:
children looked after on 31 March in each year, including unaccompanied asylum-seeking children
children looked after at any time
children who started to be looked after
children who ceased to be looked after
children looked after who were adopted
care leavers who turn 17, 18, 19, 20 or 21 years old during the year (for whom the LA has a duty to contact and offer support)
care leavers who turn 22, 23, 24 or 25 years old during the year (for whom the LA has a duty to support if the care leaver contacts and requests it)
children who went missing or away from placement without authorisation
All figures are based on data collected from the annual SSDA903 return. The longitudinal nature of the collection means historical information can be amended each year, so we update all the time series figures published in each release.
Prior to 2013, grossing factors were applied to the data in order to compensate for records with errors in their episodes. These were calculated by comparing the number of valid looked after children records reported in the return with the number of invalid records in the system. In 2013, changes to validation checks on the data submitted improved the quality and grossing factors were close to 1. After a review grossing was discontinued from 2013 onwards.
Up to 2019, the information was published as a series of data tables. From 2020 the information has been published as a series of datasets.
Prior to 2019, some of the statistics were published as experimental as they were based upon recent additions to the collection and local authorities had highlighted some data quality concerns. In 2019 we removed the ‘experimental statistics’ label from these statistics and instead published them as official statistics.
This publication is the main information source on the numbers of looked after children in England; it is used to inform policy decisions to improve outcomes for this vulnerable group of children. It is also used extensively by other organisations interested in this subject.
Children looked after on 31 March
The statistical release contains figures for the number of children looked after on 31 March between 1994 and 2025 in the dataset ‘Time series of CLA data - 1994 to 2025’ (feature table H1). Figures for earlier years were produced by the Department for Health, and were published by the House of Commons and are reproduced in Annex B.
Outcomes for children in need, including children looked after by local authorities in England statistical release
Historically underlying data has been published alongside national and local authority tables in each publication. Alongside the underlying data there is accompanying metadata.
From 2020, the publication has consisted of data sets being released on the Explore Education Statistics platform. 'Feature tables’ are available on the platform that best mirror these previously published tables.
Recent changes to the releases have included:
in 2017 some local authority tables were discontinued in the ‘Children looked after in England (including adoptions)’ release and the data was instead moved to the underlying data.
consolidation of some files to make it easier to navigate the data available
in 2025 the addition of more information on characteristics of children looked after on 31 March excluding unaccompanied asylum-seeking children
Rounding, suppression and grossing
Rounding and suppression is applied to the data. The National Statistics Code of Practice requires that reasonable steps should be taken to ensure that all published or disseminated statistics produced by the DfE protect confidentiality. The publications follow the DfE policy statement on confidentiality.
Rounding suppression and grossing for 2020 releases onwards.
National and regional figures have been rounded to the nearest 10. Local authority figures are unrounded.
Where any number is shown as zero, the original figure submitted was zero.
The following symbols have been used in the releases (updated to align with GSS standards):
‘c’ to protect confidentiality. Secondary suppression may be required
‘z’ for not applicable
‘x’ for not available (':' in 2020 and 2021 releases)
‘k’ used for a value that would round to zero but is not zero, for example where a percentage is <0.5% ('~' in 2020 and 2021 releases)
For percentages:
to protect confidentiality some numbers are replaced by ‘c’
they may not sum to 100% due to rounding
they are rounded to whole numbers
For averages:
the average duration for adoptions (formerly table E2) are rounded to the nearest month
the average number of missing or away without authorisation incidents (formerly in table G1) have been rounded to one decimal place.
Rounding suppression and grossing for 2019 releases and earlier
National and regional figures have been rounded to the nearest 10.
From 2018 local authority figures are unrounded in statistical tables. Prior to this local authority figures were rounded to the nearest 5 in tables but unrounded in underlying data tables.
Where any number is shown as zero, the original figure submitted was zero.
The following symbols have been used in the releases:
‘c’ (prior to 2019 this was a ‘x’) to protect confidentiality. Secondary suppression may be required
‘.’ for not applicable
‘..’ for not available
‘~’ used for a value that would round to zero but is not zero, for example where a percentage is <0.5%
For percentages:
to protect confidentiality some numbers are replaced by ‘c’ (prior to 2019 this was a ‘x’)
they may not sum to 100% due to rounding
they are rounded to whole numbers
For averages:
the average duration for adoptions (table E2) are rounded to the nearest month
the average number of missing or away without authorisation incidents (table G1) have been rounded to one decimal place.
Children looked after in England (including adoption) release
Whilst validation and consistency checks are in place to ensure the information published is of high quality, the following should be taken into account when reviewing the statistics on looked after children.
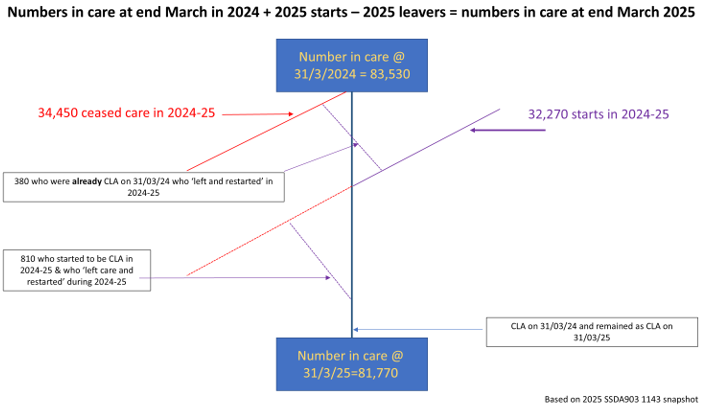
March, starts and ceased comparability
The number of looked after children on 31 March each year does not always equate to the number on 31 March the previous year plus the number who started minus the number who ceased to be looked after in the current year. This is because a child is only ever counted within each LA once as starting to be looked after during the year, and within each LA once as ceasing to be looked after during the year, but in some circumstances a child may enter care and/or leave care more than once during the year. There are also a small number of children who move in and out of respite care during the year for whom the same will apply. To illustrate this, the diagram below shows a summary of the figures for the year ending 31 March 2025 are in the diagram.
Coronavirus (COVID-19) pandemic
In 2020, the Department for Education (DfE) established the Vulnerable Children and Young People (VCYP) survey of local authorities in England to help understand the impact of the coronavirus (COVID-19) outbreak on Children’s Social Care. These figures were published regularly (opens in new tab).
The 2021 CLA release reported monthly SSDA903 data from this period. Monthly starts and ceased figures were added to the text of the statistical release for 2021 only to help describe how the pandemic affected children’s social care.
The VCYP survey had suggested the decrease in CLA starting during the year ending 31 March 2021 might have been much greater than the SSDA903 shows. Figures from the two collections may not align due to methodological differences and anecdotal evidence from local authorities suggests there can be a delay in adding CLA starting to management information systems, so children may have been missed from the VCYP survey.
Effect of children transferring between LAs and the effect on numbers of unaccompanied asylum-seeking children (UASC) starting to be looked after
Where the care of a young person is transferred between LAs, this means the period of care within the initial LA will cease and a new period of care will start at the LA the child transfers to. The child identifier collected within the CLA data collection is required to be unique within each LA but are not unique across LAs. This means we cannot individually track children and young people who start to be looked after in a LA because their care has transferred from another LA. What we do record is the number of children who cease to be looked after due to their care being taken over by another LA. These figures are in the table.
Children who cease to be looked after due to their care being transferred to another LA, 2021 to 2025
Cohort
2021
2022
2023
2024
2025
All children ceasing being looked after during the year due to care being transferred to another LA
530
940
1,210
2,140
2,640
Of which were UASC
360
570
1,040
1,970
2,460
Of which were not UASC
170
370
170
170
180
Nationally the number of non-UASC reported as having their care transferred to another LA has fluctuated by around 200 children in recent years. UASC are more likely to have responsibility for their care move between LAs. This is because the National Transfer Scheme (NTS) was introduced in 2016 as a voluntary agreement between LAs to ensure a fairer distribution of unaccompanied children across LAs. From February 2022 all LAs with children’s services in the UK have been directed to participate in the ‘mandated NTS’. This means that as the overall number of UASC has increased in recent years, a greater number have had their care transferred to another LA, and in particular in the last three years since participation in the NTS became mandatory. So using this information to adjust the numbers of children starting to be looked after by assuming they do all start a new episode of care in another LA, nationally we anticipate that the reported number of UASC starting to be looked after could be overrepresented by around 55% in 2025.
We can compare numbers of UASC starting to be looked after to information published by the Home Office on UASC applications (opens in new tab). If we adjust our starting figures for the number of young people whose care has transferred to another LA then they broadly align. There are larger differences in the two sources for some years, however changes to the HOs immigration case working system mean their published figures do not include UASC who were found to be aged over 18 years and these young people would be included in our statistics prior to being age assessed, had they been looked after by children's social care.
If we remove the number of CLA starting who were UASC from the total CLA starting during the year, we can see that the number of non-UASC CLA starting has decreased by 2% on last year.
Children starting to be looked after, who were not UASC, England 2021 to 2025
Cohort
2021
2022
2023
2024
2025
All children starting to be looked after during the year
28,470
31,100
33,090
33,130
32,270
Of which were not UASC
25,680
25,700
25,870
25,800
25,320
Not UASC year on year percentage change
-
<0.5%
+1%
<-0.5%
-2%
Population estimates
This release uses population estimates split by age and local authority published by the Office for National Statistics (ONS). The latest release of these population estimates (opens in new tab) was published on 30 July 2025.
Collecting information on the child's sex
The Department clarified that for the 2025 SSDA903 collection local authorities should report the sex of a looked after child and not the child's gender. In previous years, local authorities if they wished, could report a child's gender if it was different to their sex assigned at birth. Based on feedback from LAs, we understand the number of instances of this were small, however due to the structure of our data tables is is not easy to identify. The 2025 snapshot tables used for analysis of the SSDA903 data contain the latest reported value of a child's sex so in almost all instances this will be the child's reported sex.
Long-term fostering placements
The definition of a long-term foster placement came into effect from 1 April 2015 in The Care Planning and Fostering (Miscellaneous Amendments) (England) Regulations 2015 and is defined as:
A “long-term foster placement” means an arrangement made by the responsible authority for the child to be placed with a foster carer where:
(a) the child’s plan for permanence is foster care,
(b) the foster carer has agreed to act as child’s foster parent until the child ceases to be looked after, and
(c) the responsible authority has confirmed the nature of the arrangement to the foster carer, parents and the child.
From 2016, all children in an ongoing long-term foster placement on 1 April 2015, or those who change to a long-term foster placement after this date, should have been recorded as such.
Local authority level analysis of this data highlighted large differences in the proportion of foster placements reported as being long-term foster placements. In earlier years, quality assurance checks identified a degree of misreporting at a level that has affected our confidence in the figures and so figures for long-term fostering were not included in the main release tables. The issues around accurately capturing this included differences in recording practices, short-term placements move into being a long term placement and system issues (for example being able to ‘roll back’ the system to update, or difficulties due to system links to financial payments).
Children reported in the collection under the long-term fostering category are included in the categories ‘With other foster carer not FFA/concurrent planning’ or ‘With relative or friend, not FFA/concurrent planning’ as appropriate, in the statistical release data tables for 2016 onwards. The latest time series of the figures are shown below although it's likely they are an under-count of the true figures:
Numbers of children looked after in a long-term fostering placement, years ending 31 March 2020 to 2025
Placement
2021
2022
2023
2024
2025
CLA on 31 March in long-term fostering placements
23,920
23,230
21,770
20,810
19,870
Inside council boundary
13,980
13,440
12,490
11,950
11,520
With relative or friend
3,980
3,900
3,880
3,950
3,910
With other foster carer
10,000
9,540
8,610
8,010
7,610
Outside council boundary
9,940
9,790
9,290
8,860
8,350
With relative or friend
1,970
1,980
1,970
1,960
1,940
With other foster carer
7,970
7,810
7,310
6,910
6,420
Children starting to be CLA in long-term fostering placements
1,560
1,470
1,360
1,060
1,000
Inside council boundary
1,030
990
820
670
650
With relative or friend
520
450
390
330
360
With other foster carer
510
540
430
340
290
Outside council boundary
540
480
540
400
350
With relative or friend
210
140
180
110
110
With other foster carer
320
340
360
290
230
Children ceasing to be CLA in long-term fostering placements
3,240
3,420
3,180
3,120
3,260
Inside council boundary
1,980
2,060
1,890
1,860
1,920
With relative or friend
830
900
800
840
910
With other foster carer
1,150
1,160
1,090
1,020
1,010
Outside council boundary
1,260
1,360
1,290
1,260
1,340
With relative or friend
420
440
410
410
450
With other foster carer
840
920
880
860
900
Local authority of placement
For some children each year the local authority of placement is outside England or is not submitted due to confidentiality purposes. The local authority of placement for these children are in the table below. These children are not included in figures in data tables for the number of children externally placed in other local authorities, or figures for local authority net gain of children.
Children looked after on 31 March 2021 to 2025 who were placed outside England or whose local authority of placement was confidential
Placement location
2021
2022
2023
2024
2025
LA of placement confidential
220
240
230
240
210
Placed outside England
Of which:
840
860
830
880
850
Wales
550
550
530
600
580
Scotland
250
270
250
230
240
Northern Ireland
10
c
10
10
10
Outside UK
30
30
40
30
20
Children freed for adoption
Applications for freeing orders could not be made on or after 30 December 2005 as they were replaced by placement orders.
Effect of collecting provider unique reference numbers (Ofsted URN) on placement type
The introduction of Ofsted URN for placements on or after 1 April 2015 means users should interpret changes to placement type over time with caution.
Ofsted unique reference number (URN) was collected for settings subject to Ofsted inspections for the first time in the collection year 2015 to 2016. For example, for children’s homes this would be the URN of the individual home, and for foster or adoptive placements this would be the URN of the relevant service or agency providing the placement. This data - which covers around 90% of placements - is required for any relevant placement that was ongoing on 1 April 2015, or for any new placement after 1 April 2015.
The in-built system validation checks the placement type submitted by local authorities corresponds with the placement type for the given URN. This meant there were some corrections of placement types reported by local authorities in 2016 and 2017. In particular, there were cases where children previously recorded as being in residential schools in 2015, were recorded as being in children’s homes in 2016 and 2017 - in many cases this was because the provider may have been dual-registered.
Whilst there are always small annual revisions to previous year figures, it's possible that changes by placement type in these years may be a result of improvements in the accuracy of reporting placement types, due to collecting URN. Older placements are more likely to be misreported - a placement which was coded with the incorrect URN will not have been corrected if it ended in 2016 to 17. So, any decrease, or increase in placements over time should be interpreted cautiously.
Supported accommodation and ‘Other’ placement types in 2024
The Department for Education has introduced mandatory national standards and Ofsted registration and inspection requirements for providers of supported accommodation which accommodate children looked after and care leavers aged 16 and 17. Providers began registering as supported accommodation providers from 28 April 2023, and registration became mandatory from 28 October 2023. The legislation permits transitional arrangements whereby providers who had submitted their full application to Ofsted before the October deadline could continue to operate until that application has been determined. Where the deadline was not met, placements at these providers who were not registered with Ofsted or had not submitted a completed application by the deadline, are reported within the 'Other' category from 2024 onwards.
For the CLA collection in 2024, local authorities were expected to identify providers who had submitted an application by cross referencing their records to existing monthly lists of valid URNs provided to LAs by Ofsted. These lists included all Ofsted registered providers, but also providers who were operating as supported accommodation providers under the transitional arrangements. On acceptance of an application, a provider is issued a URN by Ofsted. However, there was some confusion in some instances on identifying when providers had applied, as depending on the monthly list used, a provider could disappear (if for example they had withdrawn their application) or not appear at all on the list (for example if the application was accepted after the 27 October and so the provider could not operate under the transitional arrangements).
Analysis of contextual information provided by local authorities when signing off their data return suggests the following:
Often local authority data contacts providing the CLA return didn’t appear to appreciate the relevance of the October deadline and the need for the application to have been accepted by Ofsted in advance of this date for the provider to operate under the transitional arrangements and be reported as a supported accommodation placement within the CLA data return.
Difficulty in identifying the provider application date (which was not on the Ofsted monthly lists), and so having to go direct to the provider to identify their URN. Some local authorities then had difficulty verifying this URN against the lists (in cases where we discussed this with the local authority and Ofsted in advance of the CLA collection deadline, we often found this was because the application was after the October deadline).
There could be some mis-reporting of providers operating under transitional arrangements. Whilst placements at these providers should have been reported as supported accommodation, on submitting their data to us some local authorities advised that within their own systems until a provider was formally fully registered with Ofsted then they would be recorded as a ‘Z1-Other’ placement.
Some LAs reported placements as ‘Z1-Other’ if the particular site/postcode for the provider operating under the transitional arrangements was not on the monthly lists. This was raised with us towards the very end of the collection, and after discussing with Ofsted we agreed these could still be counted as operating legally, but it’s possible other LAs made their own decision and reported these as ‘Z1-Other’. This is because Ofsted register providers of Supported Accommodation rather than settings. Providers may add new premises under a category they are already registered for so long as they inform Ofsted of the additional premises within 72 of opening. If the provider wishes to add premises under a new category they must be registered to provide this category before accommodating children under it.
And the additional information below was provided to explain some of the increase in ‘Z1-Other’ placements:
Many local authorities told us that these ‘Z1 - Other’ placements were former semi-independent placements at providers that had either applied to register after the deadline, or who missed submitting their application and paying their fee by the deadline (in some cases, local authorities said this was due to technical issues).
Some of the ‘Z1 - Other’ placements were former semi-independent placements where the child did not change provider as they were settled and in some cases close to leaving care, but the provider did not apply to be registered with Ofsted
Children placed in ‘Supported accommodation’ before their 16th birthday, often by just a few weeks or days. In some cases, this was because it was in their best interest, in other case this was because an alternative suitable placement was not available at short notice.
As such we recommend users are cautious when analysing the ‘supported accommodation’ and ‘other placement’ types in 2024 and when making comparisons to 2025.
Reason for placement change
For episodes that cease due to a change in placement, from 1 April 2015 the SSDA903 collection records the reason for the placement change. A full list of valid codes can be found in the guide (opens in new tab). Nationally 14,570 placements (or 25%) were recorded in the ‘Other’ category in 2025 which is similar to the 22% in 2024, 24% in 2023 and 22% in 2022 and 2021.
Feedback from local authorities suggested that placement changes due to custody were being reported within the ‘other’ category. We introduced a change for the 2019 collection to allow the identification of children changing placement due to custody, however this has had little effect on the numbers reported as ‘other’.
Reason episode ceased 'other'
The ‘reason episode ceased’ codes collected in the SSDA903 record the circumstances when a child ceases to be looked after. If a child ceases to be looked after because he/she has turned 18, this can already be deduced from his/her date of birth. Therefore, the appropriate code is used to capture the destination of the young person.
In 2014, 5,000 episodes (16%) were reported as ceasing with the code ‘Period of being looked after ceased for any other reason’. After discussion with local authority data contacts three new categories were introduced in 2015 to try to capture the reasons for these children leaving care. These categories were ‘Accommodation on remand ended’, ‘Age assessment determined child aged 18 or over’ and ‘Child moved abroad’. Despite the introduction of these new categories, in 2020 there were still 5,910 children ceasing to be looked after (20%) categorised as ‘Care ceased for any other reason’. In 2021 another category of ‘Aged 18 (or over) and remained with current carers’ was introduced which has helped reduce the number of children in the ‘Care ceased for any other reason’ category to 3,910 (14%) in 2021, 3,230 (11%) in 2022, 3,120 (10%) in 2023, 2,680 (8%) in 2024 and 2,520 (7%) in 2025.
In 2025, 1,400 (55%) of these ‘Care ceased for any other reason’ children were aged 18 years so it’s likely they ceased to be looked after as they reached 18 years of age and the more detailed code has not been provided.
Children missing from care
Information was collected for the first time in 2015 on children who were missing or away from their placement without authorisation for any length of time. Previously, information had only been collected on children who were missing or absent for at least 24 hours.
Given the changes in the way this data has been reported and the problems local authorities have identified in consistently reporting this data, comparisons over time or between local authorities should not be made.
The definitions used reflect the definitions in the statutory guidance on children who run away or go missing from home or care and are:
Missing from care – a looked after child who is not at their placement or the place they are expected to be (e.g. school) and their whereabouts is not known.
Away from placement without authorisation – a looked after child whose whereabouts is known but who is not at their placement or place they are expected to be and the carer has concerns or the incident has been notified to the local authority or the police.
Information is collected on the start and end date of the missing incident. If a child goes missing or away from placement without authorisation more than once in the same day, each separate incident is counted. It is possible that children who were missing were also away from placement without authorisation during the year, and vice versa, so the figures should not be summed to give a total number who were not at their placement during the year.
Users should exercise caution when summing the number of missing periods and away from placement without authorisation periods together, this is because an away from placement without authorisation period could become a missing period if the child’s whereabouts becomes unknown. These will appear as separate incidents in the data, but could be one continuous period where the child is not at his/her placement.
This information was initially published in 2015 as ‘experimental statistics’ given it was the first year in which the data had been collected and, therefore, local authority data collection systems and recording practices were still bedding in. In 2019 we removed this label and instead publish information on children who have gone missing as Official Statistics.
Feedback from local authorities suggests the figures are becoming more robust and some local authorities have continued to report some improvements in recording. However, since 2017 a growing number of local authorities are informing us that they do not record incidents as ‘away without authorisation’ but instead report all incidents as ‘missing’ as their primary source of this information is the police. We estimate this could mean that at a national level there is an overestimate of the number of children with missing incidents of around 12% in 2025, and an undercount of the number of children with away without authorisation incidents of around 32%. There is some variation across the country in the way these incidents are reported and so robust comparisons between local authorities are not possible. Some of these local authorities submitted some ‘away without authorisation’ information and this has been included in the tables.
Hackney were unable to provide data on children who had gone missing or who were away from placement without authorisation in 2021. We have not attempted to estimate this missing data in the overall totals.
We continue to work with local authorities to improve the quality of this data. Given the changes in the way this data has been reported, comparisons over time should not be made.
Information on children missing from care is collected separately by police forces. Details of all missing or absent incidents are provided to the UK Missing Persons Unit and they publish annual information (opens in new tab). This information is not directly comparable with the latest DfE statistics due to the different collection methods and definitions.
The missing dataset includes figures for the average duration of being missing. Around 9 in 10 of missing and 8 in 10 of away from placement without authorisation incidents are for 2 days or less. In each case, there are a small number of particularly long durations of being missing reported by local authorities in the data, which affect the value of the mean duration. Both the mean and median have been presented in the table in order to show a better descriptor of the true average value.
Measure
Average number of days per missing incident - 2025
Average number of days per away from placement without authorisation incident - 2025
25th percentile
0 days
0 days
Median
1 day
1 day
75th percentile
1 day
2 days
Mean
2 days
2 days
Note, the exact times a child went missing or away without authorisation or returned are not recorded, only the date, so the duration of missing incidents are calculated to the nearest whole day.
Placement stability
Extended placement stability analysis at national level (including breakdowns by child characteristics) were added to the publication for the first time in 2022. These focus on the following social care groups:
CLA on 31 March
CLA 12 months on 31 March - CLA continuously for at least twelve months on 31 March
CLA less than 12 months on 31 March - CLA continuously for less than twelve months on 31 March
CLA for 2 years on 31 March (added in 2023) – CLA on 31 March each year who also spent at least one day in care in the previous year ending 31 March
CLA aged under 16 on 31 March who had been looked after continuously for at least 2.5 years and who were living with the same carer for at least 2 years
For the first four of these social care groups, the figures are broken down by first placement during the year and corresponding legal status. However, for a small number of children (up to 50 in each year), their placement on 31 March has been used instead. The majority of these children were in respite care or a temporary placement for their first placement.
Care leavers aged 17, 18, 19, 20 or 21 years during the year
National figures
National figures exclude those who were looked after under an agreed series of short-term placements, those who have died since leaving care, those who have returned home to parents or someone with parental responsibility for a continuous period of at least 6 months and those whose care was transferred to another local authority.
The numbers of young people recorded as having returned home for at least 6 months, or having died after ceasing to be looked after in each year, are in the table - note a young person who has returned home for at least 6 months may be counted in more than one year, however young people who have died are only included in the table below in the year that this was first reported.
Care leavers who have returned home for at least 6 months, or have died after ceasing to be looked after, 2023 to 2025
Age
2023 Died
2023 returned home for at least 6 months
2024 Died
2024 returned home for at least 6 months
2025 Died
2025 returned home for at least 6 months
17
c
120
0
140
0
130
18
c
210
c
210
10
270
19
10
240
20
220
20
310
20
10
230
10
230
10
270
21
10
210
10
220
10
230
c - suppressed data
Suitability of accommodation
It is not possible for local authorities to determine the suitability of the accommodation where the young person was deported, had gone abroad, or their residence was not known. These accommodation types have been removed from the suitability calculations.
Care leavers for whom information is not known
The percentage of known information about activity and accommodation remains high. In 2025, for 18-year olds the figure was 95% and for 19 to 21-year olds the figure was 94%. It can be difficult to assess the year-on-year changes because of the number of care leavers for whom the information is not known. Tables F1 and F2 present the percentage of care leavers in each activity or accommodation category as a percentage of all young people. The table below shows proportions of 19- to 21-year-old care leavers in each category, based on only those where the information is known.
Activity of 19- to 21-year-old care leavers
2023
2024
2025
In higher education, i.e. studies beyond A level
7
7
7
In education other than higher education
23
22
22
In training or employment (excluding apprenticeships)
28
27
27
Apprenticeships
2
2
2
Not in education, training or employment owing to illness or disability
8
9
9
Not in education, training or employment owing to pregnancy or parenting
5
5
4
Not in education, training or employment owing to other reasons
27
28
29
Accommodation of 19- to 21-year-old care leavers
2023
2024
2025
With parents or relatives
11
12
11
Community home
3
3
3
Semi-independent, transitional accommodation
20
21
21
Supported lodgings
5
5
5
Gone abroad
k
k
k
Deported
k
k
k
Ordinary lodgings
1
1
1
Residence not known
1
1
1
No fixed abode/homeless
1
1
1
Foyers
3
3
3
Independent living
38
37
38
Emergency accommodation
1
1
1
Bed and breakfast
k
k
k
In custody
3
3
3
With former foster carers
9
9
9
Other accommodation
3
3
3
k - a percentage less than 0.5
17 and 18-year-old care leavers
The cohort for former care leavers was extended in 2016 to include care leavers aged 17 and 18 - in addition to those aged 19, 20 and 21 - who were looked after for a total of at least 13 weeks after their 14th birthday including some time after their 16th birthday.
These figures were initially released as ‘experimental statistics’, however this label was removed in 2019. Analysis suggests that in the first year of collecting the information (2016) there was under reporting by some local authorities for 17 and 18-year-olds who left care on their birthday. We believe under reporting was very small for 17-year-olds but for 18-year-olds we believe we could have been missing data for around 1,000 - 11% of young people. However, whilst we expect under reporting to remain a risk, the same level of under-reporting was not experienced in 2017 and we do not expect this to be an issue going forwards.
Care leavers aged 22, 23, 24 or 25 years during the year
The care leaver cohort was extended in 2023 to include care leavers who were aged 22, 23, 24 or 25 during the year. Whereas for younger care leavers local authorities have a duty to be in touch, for older care leavers local authorities provide support only if the young person is in touch and requests it.
The data is being collected to evidence the number and proportion of older care leavers who are requesting support from their local authority. As such, whereas information for younger care leavers is centred around the local authority contact around their birthday, the information collected on these older care leavers relates to the latest contact the young person made with the LA to request support, which could be at any point during the collection year.
In 2023,the cohort of children for whom we expected data was generated using the historic data held within the CLA23 system. Analysing the data following the collection suggests that for some ages the figures may be an undercount – we know that data is missing for 24 and 25-year-olds in North Northamptonshire and West Northamptonshire because linking in our system between these local authorities data pre- and post- LA reorganisation didn’t include older care leavers (who at the time of LA reorganisation we no longer expected to require further information).
In 2023 we suspect the number of 24-year-olds could be undercounted by up to 3% and 25-year-olds could be undercounted by up to 10% (when comparing to the number of 20- and 21-year-old care leavers reported in 2019).
Barnsley did not provide 2023 care leaver information in time for publication in 2023 - however they did provide this for the 2024 publication. Hampshire reported some data quality issues with their care leaver data due to a new record management system in 2024, but confirmed that alternative methods are being used within the authority to provide assurance of performance and outcomes.
Respite/short-breaks
Short breaks for disabled children can be provided by local authorities under either section 17 or section 20 of the Children Act 1989. The figures reported here cover those children whose short breaks were provided under section 20 of the Children Act 1989 and so only partially covers this cohort of children receiving short breaks. The apparent decrease in children receiving short breaks under section 20 of the Children Act 1989 may be due to this service being provided under section 17 instead. Whilst children receiving short breaks under section 17 of the Children Act 1989 would be counted within the children in need census, it does not collect the detail of the specific service or support provided so they cannot be identified separately.
Information on care proceedings in England: The Children and Family Court Advisory and Support Service (CAFCASS) publish information on care proceedings applications (opens in new tab) made by local authorities where CAFCASS has been appointed by the court to represent the interests of children.
Local authority children in care and adoption statistics: Children in care and adoption performance tables (published within the local authority interactive tool (opens in new tab)) show how local authorities and looked after children’s services compare with others in England.
Local authority expenditure: Information on local authority planned expenditure (opens in new tab) on schools, education, children and young people’s services is available. This data is returned to DfE by local authorities via the Section 251 Budget Return.
Ofsted statistics:Ofsted (opens in new tab) publish inspection outcomes for local authority children’s services and children’s social care providers in England as well as data on the placements of children looked after and fostering in England.
Stability Index: The Children's Commissioner published the annual Stability Index (opens in new tab) which is an annual measure of the stability of the lives of children in care. Publication of this information has been taken on by the Department for Education and some information on placement stability has been included in this release.
Data is collected and published independently by each of the four countries in the UK. Although there are similarities between the data collected by the four nations, there are also differences which may be down to different policies and legislation, and differing historical data collections.
Scotland: Statistics on children’s social work (including children looked after) in Scotland and statistics on the outcomes of looked after children in Scotland are available on the Scottish Government website (opens in new tab).
Wales: Statistics on children looked after in Wales, adoptions and outcomes are available at the time of publication for the period up to 31 March 2024 on the Welsh Government website (opens in new tab). Statistics will be transitioning to the new StatsWales service in 2026.
Northern Ireland: Statistics on children looked after in Northern Ireland and children adopted from care in Northern Ireland are published on the Department of Health website (opens in new tab).
Collection switched to one third sample. CLA100 aggregate return used to gross sample data to overall population.
1999
2000
2001
AD1 return for adopted children introduced.
All codes revamped from numeric to alphanumeric
2002
OC3 return for care leavers aged 19 introduced.
2003
2004
Collection reverted to all children. CLA100 discontinued. Collection became web-based for first time. OC1 return on educational achievements introduced,
Placement code set expanded to include temporary placements. Respite care codes split.
2005
Participation in reviews collected.
2006
Freeing orders replaced by placement orders. Reason episode ceased codes expanded to include residence orders and special guardianship orders.
2007
Code set for adoption placements expanded to incorporate placement with consent or placement order. Sex and relationship status of adopters collected. Activity of care leavers expanded to include full-time/part-time activity.
2008
Reason episode ceased expanded to include adoption orders unopposed/consent dispensed, special guardianship orders split into former foster carers/other, sentenced to custody collected.
2009
OC2 return for outcomes for looked after children introduced. Adoption decision return introduced.
LA of placement code set expanded to include other constituent countries. Placement provider collected. SDQ information introduced.
2010
Ethnicity code set revised to align with school census.
2011
Care leaver accommodation code expanded to incorporate care leavers with former foster carers.
2012
OC1 discontinued.
2013
UPNs collected for all children of school age. Activity at 16 discontinued.
2014
OC3 expanded to include care leavers aged 19 to 21. Pervious permanence return introduced.
Episode information expanded to include postcode for all placements. In touch information for care leavers redefined and switched from numeric to alphanumeric.
2015
Missing return for children going missing/away without authorisation for any period introduced.
Reason episode ceased expanded for further details. Foster codes extension to include Fostering for Adoption (FFA) and long-term fostering. Relationship status of adopters expanded to include same sex marriage.
2016
OC3 expanded again to include care leavers aged 17 to 21.
Ofsted URN of placement collected. Reason for placement change collected. Reason for new episode code expanded to incorporate children staying with same carer. Activity of care leavers expanded to include Not in employment, education or training (NEET) due to parenting or pregnancy.
2017
2018
2019
Reason episode ceased expanded to cover more information on special guardianship orders (SGOs).
'Custody’ added as a reason for placement change
2020
2021
Reason episode ceased category added to identify those remaining with current carers.
2022
Care leaver activity code set was extended to allow identification of those on apprenticeships
2023
Care leaver cohort was extended to cover those aged 22 to 25 years old during the year
2024
Social worker episodes throughout the year for any CLA on 31 March were added.
2025
New placement code ‘K3’ was introduced to identify supported accommodation placements
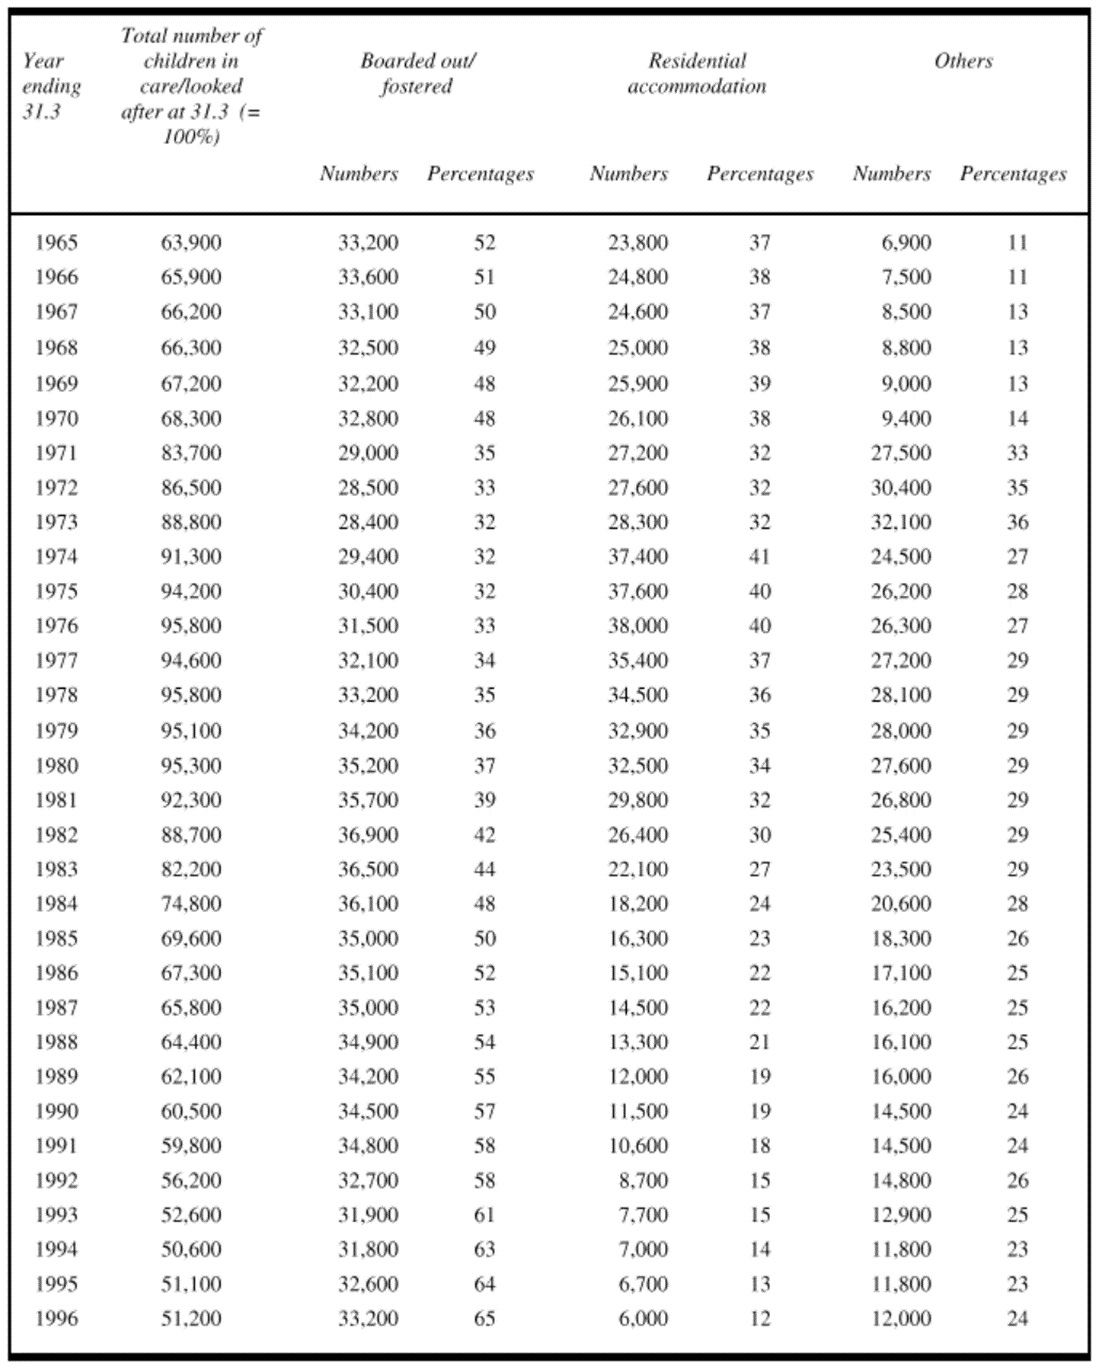
Annex B: Children looked after figures - 1965 to 1996
Figures for the number of children looked after from 1994 to the current year are available in table H1 of the statistical release. Figures for earlier years were produced and published on 1 July 1998 by the House of Commons in the report ‘Health – Second Report (opens in new tab)’ by the Department for Health. Figures are in paragraph 33 and are reproduced below: