Children looked after in England including adoptions
Children looked after, care leavers and children adopted in England. Annual statistics including characteristics, placement information and health outcomes.
Quick links
Next release
All releases in this series- Published

Headline facts and figures
- Summary
- Chart for Children looked after on the 31 March increased by 1% in 2026
- Table for Children looked after - children starting and ceasing during the year and on the 31 March
Export options for headlines
Children looked after on 31 March 2026
82,910
Up 1% on 2025
CLA rate per 10,000 children aged under 18 years
69
Up from 68 in 2025
Children looked after on 31 March 2026 who were UASC
6,000
Down 9% on 2025
Children looked after on 31 March 2026, excluding UASC
76,920
Up 2% on 2025
Children who ceased to be looked after, due to adoption
2,720
Down 11% on 2025
Children who ceased to be looked after, due to a SGO
3,870
Down 6% on 2025
The number of CLA reported by local authorities on 31 March increased by 1% (up 1,190 children) compared to last year - now at 82,910 children. The increase is due to the number of non-UASC CLA which has risen by 2% (1,770 children), whilst the number of CLA who were UASC has fallen by 9% (down 580 children).
The rate of all CLA per 10,000 children aged under 18 years has increased to 69 - up from 68 last year but down from a recent peak of 71 in 2023.
The number of children starting to be looked after during the year has increased and the number of CLA ceasing during the year has fallen. CLA ceasing due to being the subject of a special guardianship order (SGO) decreased by 6% (down 240 children) and CLA adopted decreased by 11% (down 350 children).
Under the Children Act 1989, a child is looked-after by a local authority if he or she falls into one of the following: is provided with accommodation, for a continuous period of more than 24 hours [Children Act 1989, Section 20 and 21], is subject to a care order [Children Act 1989, Part IV], or is subject to a placement order
Export options for Children looked after on the 31 March increased by 1% in 2026
Children looked after on the 31 March increased by 1% in 2026
England, Years ending 31 March 1994 to 2026
Line chart showing how the numbers of each population have changed since 1994
Footnotes for Children looked after on the 31 March increased by 1% in 2026
- Numbers have been rounded to the nearest 10. Historical data may differ from older publications which is mainly due to amendments made by local authorities after the previous publication. Figures exclude children looked after under a series of short-term placements.
- Only the first occasion on which a child started to be looked after in the LA during year has been counted. The number of CLA starting will include a small amount of double counting of children and young people whose care whose care transfers between LAs. These children will be counted as starting a period of care once within each LA responsible for their care during the reporting year. Nationally, for non-UASC, this has been broadly 200 children in recent years. UASC are more likely to have responsibility for their care move between LAs, due to the National Transfer Scheme (NTS), and as the number of UASC increase the number transferring between LAs (and so the number being double counted) will increase. See the methodology document for further information.
- Only the last occasion on which a child ceased to be looked after in the LA during the year has been counted. The care of a small number of children each year is transferred between LAs, in national figures these children will be counted as ceasing once within each LA. For more information see the methodology document.
Source: SSDA903
Export options for Children looked after - children starting and ceasing during the year and on the 31 March
| Number | |||||||||||||||||||||||||||||||||
|---|---|---|---|---|---|---|---|---|---|---|---|---|---|---|---|---|---|---|---|---|---|---|---|---|---|---|---|---|---|---|---|---|---|
| 2026 | 2025 | 2024 | 2023 | 2022 | 2021 | 2020 | 2019 | 2018 | 2017 | 2016 | 2015 | 2014 | 2013 | 2012 | 2011 | 2010 | 2009 | 2008 | 2007 | 2006 | 2005 | 2004 | 2003 | 2002 | 2001 | 2000 | 1999 | 1998 | 1997 | 1996 | 1995 | 1994 | |
| Children looked after on 31 March | 82,910 | 81,720 | 83,520 | 83,740 | 82,090 | 80,780 | 80,000 | 78,140 | 75,360 | 72,600 | 70,400 | 69,460 | 68,790 | 68,060 | 67,070 | 65,500 | 64,460 | 60,920 | 59,360 | 59,960 | 60,300 | 60,950 | 61,190 | 60,810 | 59,710 | 58,890 | 58,100 | 55,460 | 53,330 | 50,870 | 50,000 | 48,680 | 47,590 |
| Children starting to be looked after during the year | 33,790 | 32,310 | 33,120 | 33,090 | 31,100 | 28,470 | 31,010 | 31,780 | 32,190 | 32,940 | 32,160 | 31,350 | 30,730 | 28,970 | 28,390 | 27,520 | 28,090 | 25,680 | 23,250 | 23,960 | 24,590 | 24,910 | 25,020 | 24,390 | 24,810 | 24,630 | 28,400 | 28,090 | 29,610 | 29,560 | 31,710 | 31,720 | 30,220 |
| Children ceasing to be looked after during the year | 32,990 | 34,530 | 33,790 | 31,860 | 30,230 | 28,120 | 29,710 | 29,570 | 30,050 | 31,410 | 31,850 | 31,350 | 30,600 | 28,650 | 27,520 | 27,120 | 25,310 | 25,010 | 24,500 | 24,980 | 25,900 | 25,940 | 25,740 | 24,580 | 25,680 | 25,290 | 26,730 | 26,820 | 29,090 | 29,760 | 31,900 | 32,410 | 32,130 |
| Children looked after on 31 March excluding unaccompanied asylum-seeking children | 76,920 | 75,150 | 76,070 | 76,340 | 76,420 | 76,630 | 74,920 | 73,000 | 70,800 | 67,890 | 66,060 | 66,700 | 66,740 | 66,110 | 64,840 | 62,760 | 60,980 | 57,030 | 55,830 | 56,570 | 56,930 | 57,790 | 58,190 | x | x | x | x | x | x | x | x | x | x |
Footnotes for Children looked after - children starting and ceasing during the year and on the 31 March
- Numbers have been rounded to the nearest 10. Historical data may differ from older publications which is mainly due to amendments made by local authorities after the previous publication. Figures exclude children looked after under a series of short-term placements.
- Only the first occasion on which a child started to be looked after in the LA during year has been counted. The number of CLA starting will include a small amount of double counting of children and young people whose care whose care transfers between LAs. These children will be counted as starting a period of care once within each LA responsible for their care during the reporting year. Nationally, for non-UASC, this has been broadly 200 children in recent years. UASC are more likely to have responsibility for their care move between LAs, due to the National Transfer Scheme (NTS), and as the number of UASC increase the number transferring between LAs (and so the number being double counted) will increase. See the methodology document for further information.
- Only the last occasion on which a child ceased to be looked after in the LA during the year has been counted. The care of a small number of children each year is transferred between LAs, in national figures these children will be counted as ceasing once within each LA. For more information see the methodology document.
Source: SSDA903
Background information
This release provides information on children looked after (CLA) in England, including numbers of CLA adopted, care leavers and CLA who were missing from their placement. Data is taken from the annual SSDA903 data collection which is collected from local authorities in England.
The latest statistics relate to the year ending 31 March 2026 and comparisons are to the year ending 31 March 2025 unless otherwise stated. Each year local authorities can revise previous years' data so figures for earlier years may have changed compared to previous releases of this data. The standard period for data in this release is for the year ending 31 March 2022 to the year ending 31 March 2026.
Users of the data should be aware that:
- many of the changes over time within the release are influenced by variations in the number of unaccompanied asylum-seeking children (UASC) who are a distinct cohort, with specific characteristics, for example they are generally male, aged 16+ years, with relatively short periods of care.
- when making comparisons to 2022 users should be cautious as figures for 2022 may have been affected by recovery from the COVID-19 pandemic (whose initial effects were visible in the statistics for 2021).
- Information on placement stability previously published within this release will now be published in the statistical release ‘Stability measures for children looked after in England’ (opens in new tab)
All CLA on 31 March
In 2026, the number of children looked after (CLA) by local authorities in England was 82,910, up 1% (1,190 children) on last year, but still down from a recent peak of 83,740 in 2023. This is a rate of 69 CLA per 10,000 children, up from 68 last year.
Excluding unaccompanied asylum-seeking children, the number of CLA was 76,920, up by 2% (1,770) on last year; this follows small decreases seen in each year since 2022.
Throughout the reporting year, there were 115,120 children looked after, similar to last year (down <0.5%, 320 children).
Number of children looked after on 31 March and during the year, 2022 to 2026, England
| Year | 2022 | 2023 | 2024 | 2025 | 2026 |
|---|---|---|---|---|---|
| Number of children looked after on 31 March | 82,090 | 83,740 | 83,520 | 81,720 | 82,910 |
Annual change | - | +1,660 | -230 | -1,800 | +1,190 |
Annual percentage change | - | +2% | < -0.5% | -2% | +1% |
Rate per 10,000 children (<18 years) | 70 | 71 | 70 | 68 | 69 |
| Number of children looked after on 31 March - excluding UASC | 76,420 | 76,340 | 76,070 | 75,150 | 76,920 |
Annual change | - | -80 | -260 | -930 | +1,770 |
Annual percentage change | - | < -0.5% | < -0.5% | -1% | +2% |
| Number of children looked after at some point during the year | 111,440 | 114,760 | 116,470 | 115,440 | 115,120 |
Annual change | - | +3,310 | +1,710 | -1,030 | -320 |
Annual percentage change | - | +3% | +1% | -1% | < -0.5% |
Source: SSDA903
Characteristics
Note: Many of the changes in characteristics seen in recent years have been driven by changes in the number of UASC who are a distinct cohort with specific characteristics.
Sex, ethnicity and age on 31 March
Males are slightly over-represented in the CLA population (56%) compared to the overall child population (51%) - as shown in the latest ONS mid-year population estimates (opens in new tab). Some of this is due to UASC, however males are still slightly over-represented for non-UASC CLA (53%).
Children from Mixed ethnic groups were over-represented and children from Asian ethnic groups were under- represented (opens in new tab) in the numbers of CLA compared to the overall child population. Children of White ethnicity account for 72% of CLA, 11% were Mixed or Multiple ethnic groups, 8% Black, African, Caribbean or Black British, 5% were Asian or Asian British, 4% other ethnicities, and ethnicity was not known or not yet recorded for 1%.
CLA are primarily from an older demographic - 64% were aged 10 years or older. Since 2022, whilst the overall number of CLA have increased by 1%, CLA aged 4 years or younger have decreased by 8% (1, 260 children), however the number of CLA aged 4 years or younger has increased in 2026 compared to 2025.
Export options for CLA on 31 March, by age, 2022 to 2026
| Number | Percentage | ||||||||||
|---|---|---|---|---|---|---|---|---|---|---|---|
| 2022 | 2023 | 2024 | 2025 | 2026 | 2022 | 2023 | 2024 | 2025 | 2026 | ||
| Age group | Total children | 82,090 | 83,740 | 83,520 | 81,720 | 82,910 | 100% | 100% | 100% | 100% | 100% |
| Under 1 year | 3,960 | 3,830 | 3,730 | 3,630 | 3,680 | 5% | 5% | 4% | 4% | 4% | |
| 1 to 4 years | 11,300 | 11,080 | 10,730 | 9,990 | 10,320 | 14% | 13% | 13% | 12% | 12% | |
| 5 to 9 years | 14,870 | 14,890 | 15,010 | 15,110 | 15,660 | 18% | 18% | 18% | 18% | 19% | |
| 10 to 15 years | 31,690 | 31,880 | 31,430 | 30,940 | 31,110 | 39% | 38% | 38% | 38% | 38% | |
| 16 years and over | 20,270 | 22,070 | 22,620 | 22,050 | 22,140 | 25% | 26% | 27% | 27% | 27% | |
Footnotes for CLA on 31 March, by age, 2022 to 2026
- Numbers have been rounded to the nearest 10. Percentages rounded to the nearest whole number. Figures in some tables may be suppressed, denoted by a 'c', percentages <0.5% are denoted by a 'k' . Historical data may differ from older publications which is mainly due to amendments made by local authorities after the previous publication. However, users looking for a longer time series may wish to check for the equivalent table in earlier releases of this publication. Figures exclude children looked after under a series of short-term placements.
Source: SSDA903
Explore and edit this data online for CLA on 31 March, by age, 2022 to 2026
Use our table tool to explore this data.
Explore data for CLA on 31 March, by age, 2022 to 2026Reasons for being looked after
When a child is assessed by children's services their primary need is recorded. For CLA this corresponds to the most relevant need at the time the current period of being looked-after began. This list is hierarchical and where more than one need is identified then the need ‘highest’ up the list is reported.
The proportion of CLA reported within each primary need has been broadly stable over the last five years.
Reasons recorded for being looked after include the following:
- as a result of or because they were at risk of abuse or neglect
- primarily due to living in a family where the parenting capacity is chronically inadequate (family dysfunction)
- due to there being no parents available to provide for the child (absent parenting)
- due to living in a family that is going through a temporary crisis that diminishes the parental capacity to adequately meet some of the children’s needs (family being in acute stress)
- due to the child’s or parent’s disability or illness
- due to low income or socially unacceptable behaviour
Export options for The majority of all CLA are looked after due to a primary need of abuse or neglect
| Number | Percentage | ||||||||||
|---|---|---|---|---|---|---|---|---|---|---|---|
| 2022 | 2023 | 2024 | 2025 | 2026 | 2022 | 2023 | 2024 | 2025 | 2026 | ||
| Category of need | Total children | 82,090 | 83,740 | 83,520 | 81,720 | 82,910 | 100% | 100% | 100% | 100% | 100% |
| N1. Abuse or neglect | 54,150 | 54,690 | 55,040 | 54,850 | 56,840 | 66% | 65% | 66% | 67% | 69% | |
| N2. Child's disability | 2,020 | 1,930 | 1,940 | 1,890 | 1,910 | 2% | 2% | 2% | 2% | 2% | |
| N3. Parental illness or disability | 2,200 | 2,100 | 2,000 | 1,940 | 1,950 | 3% | 3% | 2% | 2% | 2% | |
| N4. Family in acute stress | 6,050 | 6,080 | 5,950 | 5,740 | 5,740 | 7% | 7% | 7% | 7% | 7% | |
| N5. Family dysfunction | 10,830 | 10,550 | 10,150 | 9,610 | 9,310 | 13% | 13% | 12% | 12% | 11% | |
| N6. Socially unacceptable behaviour | 910 | 900 | 830 | 810 | 740 | 1% | 1% | 1% | 1% | 1% | |
| N7. Low income | 90 | 90 | 70 | 70 | 80 | k | k | k | k | k | |
| N8. Absent parenting | 5,830 | 7,410 | 7,530 | 6,810 | 6,340 | 7% | 9% | 9% | 8% | 8% | |
Footnotes for The majority of all CLA are looked after due to a primary need of abuse or neglect
- Numbers have been rounded to the nearest 10. Percentages rounded to the nearest whole number. Figures in some tables may be suppressed, denoted by a 'c', percentages <0.5% are denoted by a 'k' . Historical data may differ from older publications which is mainly due to amendments made by local authorities after the previous publication. However, users looking for a longer time series may wish to check for the equivalent table in earlier releases of this publication. Figures exclude children looked after under a series of short-term placements.
- Category of need is the main category of the eight “need codes” at the time the child started to be looked after.
Source: SSDA903
Explore and edit this data online for The majority of all CLA are looked after due to a primary need of abuse or neglect
Use our table tool to explore this data.
Explore data for The majority of all CLA are looked after due to a primary need of abuse or neglectLegal status
Information is collected on the legal status underlying being ‘looked-after’, which helps to describe why the child is being looked after. These include:
- a care order - a court order placing a child in the care or supervision of a local authority
- a voluntary agreement - this allows the local authority to provide accommodation for a child where there's parental consent, or when no-one with parental responsibility is in place
- a placement order - a court order allowing a local authority to place a child for adoption
- detained for child protection reasons
- detained under youth justice legal statuses
In 2026, most CLA were looked after under a care order (75%), 19% of CLA were looked after under voluntary agreement and 6% under a placement order. In addition, less than 0.5% of CLA were detained for child protection or youth justice reasons.
These figures on CLA on 31 March, by characteristics can be found in table A1.
Placements
The majority of CLA (66%) were placed in foster placements, where an approved carer looks after the child. 13% were placed in children’s homes and secure homes, 10% were placed in supported accommodation, 6% were placed with parents and 2% were placed for adoption. The remaining children were in residential or ‘other’ placements.
These figures on CLA on 31 March, by placement type can be found in table A2.
Foster placements
Since last year, the number of CLA in foster placements have increased slightly, up 1% to 54,900 (up 360 children) however the proportion of CLA in foster placements has decreased slightly to 66% - from 67%. A quarter (25%) of foster placements are with a relative or friend who is an approved foster carer - CLA in these foster placements increased by 4% since last year, to 13,960 (up 590 children).
Children in all foster placements, and in foster placements with a relative or friend, 31 March 2022 to 2026
| Foster placements | 2022 | 2023 | 2024 | 2025 | 2026 |
|---|---|---|---|---|---|
| Number of CLA in foster placements | 57,180 | 56,610 | 55,930 | 54,540 | 54,900 |
Year on year change | . | -570 | -680 | -1,380 | +360 |
Percentage (of all CLA) in foster placements | 70% | 68% | 67% | 67% | 66% |
| Number of CLA in foster placements with a relative or friend | 12,600 | 12,880 | 13,560 | 13,370 | 13,960 |
Year on year change | . | +280 | +680 | -190 | +590 |
Percentage (of CLA in foster placements) in a foster placement with a relative or friend | 22% | 23% | 24% | 25% | 25% |
Source: SSDA903
Placed for adoption
Fewer CLA are placed for adoption - the number of CLA placed for adoption decreased by 17% to 1,510 children (down 310 children) and is down 36% since 2022. However, the proportion of all CLA who were placed for adoption is 2% - the same as last year. Placed for adoption means the child has gone to live with prospective adopters. A child may be placed for adoption with the formal consent of the child’s parents/guardian or with a placement order from a court and may be placed for adoption with their current foster carer or with a stranger or relative who is an approved adopter.
Children’s homes
More CLA are being placed in children's homes (including secure children's homes) - 10,710 - which is an increase of 13% (1,220 children) compared to last year. 13% of all CLA are in children’s homes, up from 12% last year and up from 9% in 2022.
Other placements
Changes to the code set in 2026 has allowed identification of CLA placed with unregistered carers or providers (previously reported within the ‘Other’ category) - 1,240 (1% of CLA) were placed with unregistered carers or providers on 31 March 2026. Of these, 30% were awaiting availability of an alternative placement and 70% were placed in the child's best interests.
Locality of placements
Local authorities have a general duty to provide accommodation that is within the local authorities' area, that meets the needs of the child and allows the child to live near their home.
The proportion of placements inside the council boundary was 56%, up slightly from 55% last year - the remaining 44% were placed outside the boundary.
Placement of CLA by whether the placement was inside or outside the LA boundary, 31 March 2022 to 2026
| Location | 2022 | 2023 | 2024 | 2025 | 2026 |
|---|---|---|---|---|---|
| All placements | 82,090 | 83,740 | 83,520 | 81,720 | 82,910 |
Inside the LA boundary | 46,700 | 47,070 | 45,980 | 45,350 | 46,290 |
Percentage | 57% | 56% | 55% | 55% | 56% |
Outside the LA boundary | 35,380 | 36,680 | 37,530 | 36,370 | 36,620 |
Percentage | 43% | 44% | 45% | 45% | 44% |
Source: SSDA903
The majority of CLA were placed within 20 miles of home:
- placed within 20 miles of home - 70% - up slightly from 69% last year
- placed over 20 miles from home - 22% - the same as last year
- information for the remaining 8% was not known or not recorded - down slightly from 9% last year. In most cases this will be because the child was UASC, but it could also be because the home address was not known or for reasons of confidentiality.
Location of placement varies by type of placement. Placements with the highest proportion of children:
- placed over 20 miles from home are those where the child is placed for adoption (51%)
- placed 20 miles or less from home are those where the child is placed with parents/other person with parental responsibility (92%) or in a foster placement (76%)
CLA by region and by local authority
Regions
Numbers and rates per 10,000 children vary widely across regions. The North East has the largest number of CLA per 10,000 children at 121 and Outer London has the lowest at 44. The North East has also seen the largest increase in the rate of CLA since 2022, up from 109. The largest decrease has been in the North West where the rate has decreased from 97 in 2022 to 91 in 2026.
Local authorities
The rate per 10,000 children also varies across local authorities, for example Blackpool has the highest rate at 192 CLA per 10,000 children and Harrow has the lowest at 27 CLA per 10,000 children. Excluding the City of London and the Isles of Scilly (which have relatively small numbers of children), the largest increase in rate was in Redcar and Cleveland (from 125 to 162) and the largest decrease was in North East Lincolnshire (from 186 to 126).
Unaccompanied asylum-seeking children (UASC)
UASC are children, who have applied for asylum in their own right and are separated from both parents and/or any other responsible adult. Local authorities have a legal duty to provide accommodation for these children.
There were 6,000 UASC on 31 March 2026, down 9% (580 children) on last year. During the pandemic there was a drop in the number of UASC to 4,150 in 2021, which increased to a peak of 7,440 in 2024, but has then fallen in each of the last two years.
Characteristics of unaccompanied asylum-seeking children
UASC are a distinct group of CLA and currently represent 7% of all CLA - down from 8% last year.
Most UASC are male - 93%. However, whilst a much smaller proportion are female - 7% - their numbers have been increasing, up a third since 2022 to 400 children in 2026.
UASC are also usually older - 91% were aged 16 years or older, compared to 27% of all CLA.
94% of UASC have a primary need of 'Absent parenting' - a further 4% were in need due to abuse or neglect and 1% due to the family being in acute stress. [Note: These percentages have changed since last year largely due to revisions made by LAs - in most cases we expect the primary need of UASC to be ‘Absent parenting’].
UASC tend to present themselves at points of entry into the country. Since February 2022 there has been a mandated national transfer scheme (opens in new tab) in place to enable the safe transfer of unaccompanied children between local authorities across the country to help ensure that unaccompanied children have access to services and support they need. Prior to this, the scheme was voluntary. Kent (432 young people), Manchester (167) and Birmingham (140) were looking after the largest number of UASC on 31 March 2026.
38% of UASC are from ‘Black or Black British ethnic groups’ - these are mainly African ethnicities which have increased from 21% of UASC CLA in 2022 to 34% in 2026. 37% were of ‘Other’ ethnic groups, 20% of Asian or Asian British ethnicity, 2% White, 1% Mixed ethnicity and ethnicity was not known for 1%.
Placements of unaccompanied asylum-seeking children
The placements for UASC tend to reflect the fact that they are older. 62% were accommodated in supported accommodation placements, 35% were in foster placements, 1% were in children's homes and secure children's homes and 2% were in ‘Other’ placements.
Figures on CLA on 31 March who were UASC can be found in table A3.
CLA on 31 March, excluding UASC
There were 76,920 CLA on 31 March, excluding unaccompanied asylum-seeking children. This was an increase of 2% (1,770 children) on last year.
When UASC are excluded from the 31 March population count, the main differences are:
- for sex - the proportion of CLA who were male, is lower (53% compared to 56%) but males are still overrepresented in the CLA population.
- for age - the proportion of CLA aged 16 or over is lower (22% compared to 27%)
- for primary need - a higher proportion are looked after due to abuse or neglect (74% compared to 69%) and fewer are looked after due to absent parenting (1% compared to 8%)
- for ethnicity - a greater proportion are white (77% compared to 72%) which means white ethnicities are overrepresented in the CLA non-UASC population compared to the overall population.
- for legal status - a higher proportion are CLA under a care order (81% compared to 75%) and fewer are CLA under a voluntary agreement (12% compared to 19%).
Further figures can be found in table A6.
CLA starting during the year
The number of children starting to be looked after during the year (CLA starting) is 33,790, up 5% (1,480 children) on last year.
Counts of the number of CLA starting relate to the first time the child started to be looked after in each LA during the year. They will include some double counting of children and young people whose care was transferred from another LA (for example UASC transferred under the National Transfer Scheme (opens in new tab) - these children will be counted as starting a period of care once within each LA that was responsible for their care during the reporting year as we cannot reliably track all children across LAs).
Adjusting for this, we estimate the number of CLA starting during the year could be more like 29,670 in 2025 and 31,200 in 2026, an increase of 5%.
| Population count | 2025 | 2026 |
|---|---|---|
| Reported CLA starting during the year | 32,310 | 33,790 |
Of whom were non-UASC | 25,330 | 26,920 |
Of whom were UASC | 6,980 | 6,870 |
| CLA ceasing during the year, whose care transferred to another LA (and so will be potentially double counted as a start) | 2,640 | 2,590 |
Of whom were non-UASC | 180 | 180 |
Of whom were UASC | 2,460 | 2,410 |
| Adjusted number of all CLA starting during the year (excluding where care transferred) | 29,670 | 31,200 |
| Adjusted number of UASC starting (excluding where care transferred) | 4,520 | 4,460 |
56% of CLA starting were initially looked after under a voluntary agreement under S20 of the Children Act 1989, and 33% were initially looked after under a care order, however a child's legal status is likely to change during their period of care. 10% (3,370 children) were initially detained for child protection reasons and 1% (460 children) for youth justice reasons.
A small proportion of CLA starting during the year were known to have previously had a permanence arrangement - 630 children. These children were known to have previously been adopted (less than 0.5% of all CLA starting), been the subject of a special guardianship order (1% of all CLA starting) or been the subject of a residence order or child arrangement order (less than 0.5% of all CLA starting).
Further information on CLA starting by characteristics can be found in table C1, and by placement can be found in table C2.
Conviction and health outcomes
Figures in this section relate to the 58,480 CLA on 31 March who had been CLA for at least 12 months in the year ending 31 March 2026 unless otherwise stated.
Definitions and explanations of the information collected can be found in the CLA data collection guide (opens in new tab) and in the footnotes of the table below.
Offending rates
Information in this section on offending rates is collected for children aged 10 years or over – 40,700 children in 2026.
The proportion of CLA who were convicted or were subject to youth cautions or youth conditional cautions during the year was:
- 2% for all CLA aged 10 years or over – the same as last year
- 3% for CLA aged 16 to 17 years – down from 4% last year and almost three quarters (74%) of the cohort who offended
- 1% for CLA aged 13 to 15 years – the same as last year and 25% of the cohort who offended
More males offend than females - 2% of males were convicted or subject to youth cautions or youth conditional cautions during the year compared to 1% of females - a similar pattern to previous years.
Figures on offending can be found in table I1.
Substance Misuse
3% of CLA were identified as having a substance misuse problem which is the same as last year and the same as in 2022.
An intervention was received by 44% of children who were identified as having a substance misuse problem, up from 41% last year. Interventions may include for example, advice and guidance, therapeutic support or support targeting the problems that are causing difficulties for the young person, like family contact, placement stability, school attendance or the young person's mental health.
Figures on substance misuse can be found in table I2.
Health and development outcomes
Most CLA are up to date with their health care and immunisations - figures are similar to last year:
- Development assessments up to date (under 5s) - 88%
- Had annual health assessment - 89%
- Had their immunisations up to date - 83%
- Had their teeth checked by a dentist - 83%
During the COVID-19 pandemic the proportion of CLA with their teeth checked during the year fell, however since then the proportion has continued to increase and is now back to pre-pandemic levels.
Figures on health and development outcomes can be found in tables I3 and I4.
Emotional and behavioural health (SDQ scores)
Strengths and Difficulties Questionnaire (SDQ) scores - the SDQ is a behavioural screening questionnaire. Its primary purpose is to give social workers and health professionals information about a child’s wellbeing. A score of 0 to 13 is considered normal, 14 to 16 is borderline, and 17 to 40 is a cause for concern.
For CLA aged 5 to 16 years (43,240 children), an SDQ score was reported for 79% of them - up slightly from 78% last year. The average score reported was 14.9 - the same as last year but up from 13.8 reported in 2022.
Of these 34,180 children for whom, a SDQ score was reported:
- 44% had ‘normal’ emotional and behavioural health (down slightly from 45% and down from 50% in 2022)
- 13% had ‘borderline’ scores (the same as last year and up slightly on 12% in 2022)
- 43% had scores which were a cause for concern (up slightly from 42% last year and up from 37% in 2022).
In 2026, 45% of males had a score which was a cause for concern compared to 40% of females. When analysed across age groups, in the younger age groups a greater proportion of males than females have scores which were a cause for concern; however for 15 and 16 year olds, this switches and a greater proportion of females than males have a score which is a cause for concern.
Younger age groups (aged 10 and under) have seen larger increases in the proportion of children with a SDQ score that was a cause for concern, since 2022. For older ages (over 10 years) whilst there has been an increase in almost all age groups, it has been much smaller.
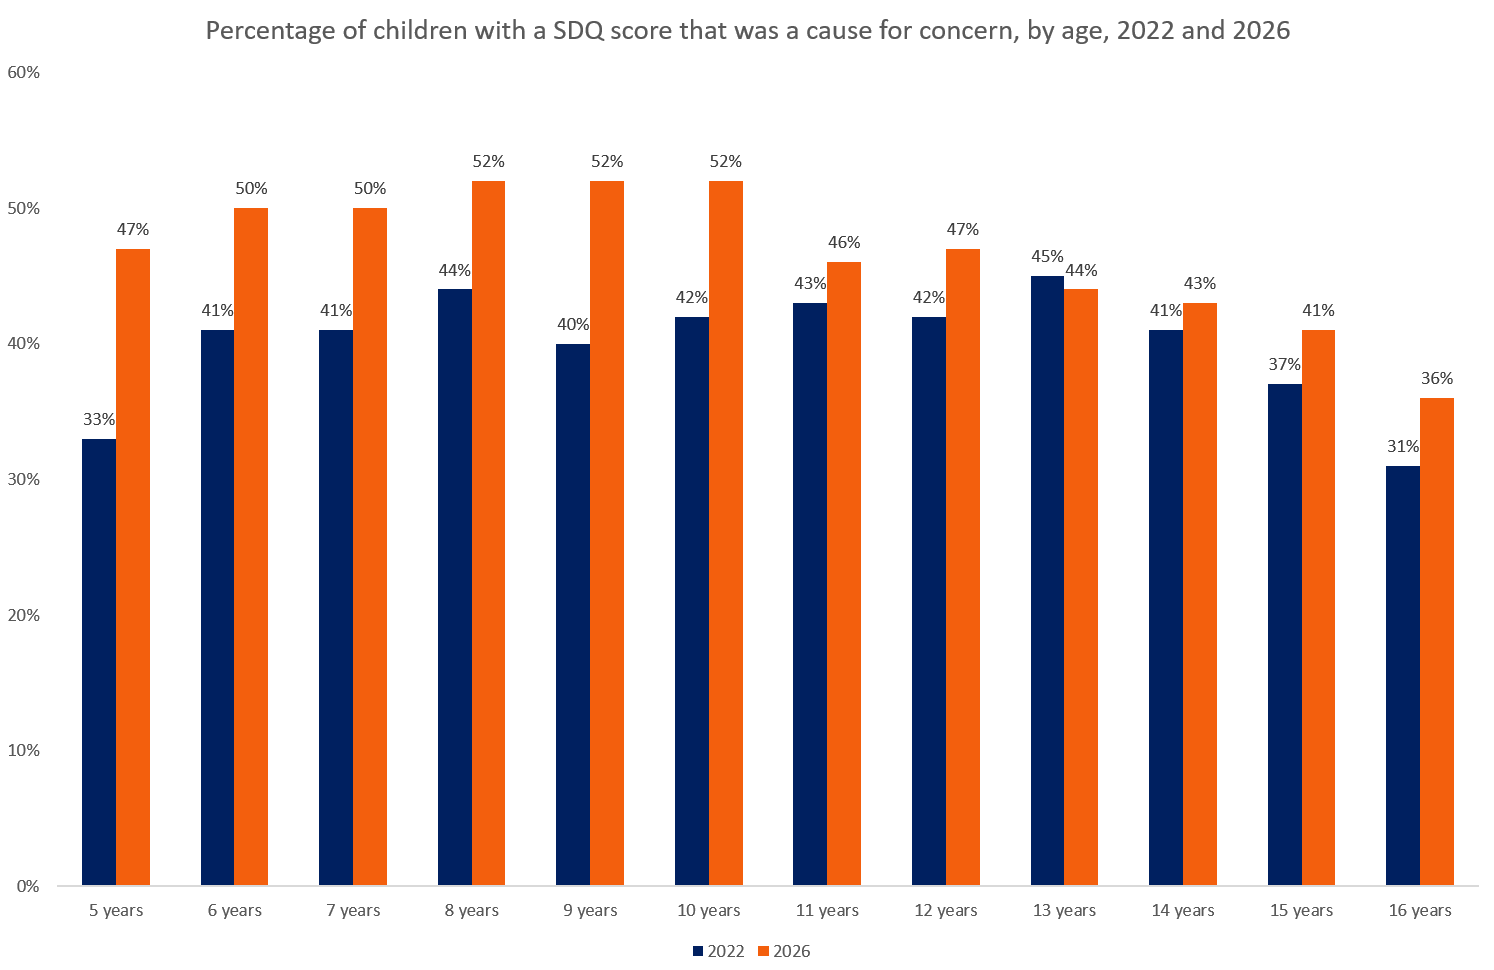
Figures on the SDQ scores of CLA can be found in table I5 of this release.
CLA ceasing during the year
Counts of the number of children ceasing to be looked after during the year (CLA ceasing) relate to the last time the child ceased to be looked after during the year in each LA. However, there may be some double counting of children if a child's care transfers to another LA, and then the child ceases to be looked after in the subsequent LA within the same reporting year.
The total number of CLA ceasing during the year decreased by 4% since last year to 32,990 (1,540 children). This count includes children and young people whose care transferred to another LA - 8% of all CLA ceasing- which is the same as last year but has steadily increased in recent years due to the number of UASC, whose care is more likely to transfer due to the National Transfer Scheme. Overall numbers of CLA ceasing during the year can be found in the table below.
Adjusting for these transfers, we estimate the number of CLA ceasing during the year could be more like 31,890 in 2025 and 30,400 in 2026, a decrease of 5%.
| Population count | 2025 | 2026 |
|---|---|---|
| All CLA ceasing during the year | 34,530 | 32,990 |
| CLA ceasing during the year whose care transferred to another LA | 2,640 | 2,590 |
| CLA (excluding when care transfers to another LA) ceasing during the year | 31,890 | 30,400 |
Reasons for ceasing to be looked after
The most common reasons for children and young people leaving care were because they reached age 18 (but stayed with current carers) or because they returned home to live with parents or other person with parental responsibility which was part of the care planning process.
Duration of period of care for CLA ceasing during the year
30% of CLA ceasing had been looked after for under 6 months, up from 28% last year.
The average (mean) duration of the last period of care was 904 days (almost 2 years and 6 months), an increase of 12 days on last year.
Further information on CLA ceasing can be found in the ‘D’ tables.
Adoptions and special guardianship orders (SGOs)
The number of CLA ceasing due to adoption or as the subject of a special guardianship order have both decreased compared to last year:
- Adoptions have decreased by 11% - to 2,720 - a decrease of 350 children
- Special guardianship orders have decreased by 6% to 3,870 - a decrease of 240 children.
Adoptions
Adoptions rose sharply from 3,090 in 2011 to a peak of 5,360 in 2015, but then steadily decreased back to 2,890 in 2021. The decrease followed two court rulings in 2013, which stated that adoption orders should be made only when there was no other alternative, such as placing a child with birth relatives. There was a further fall in 2021 during the pandemic, which was a result of the impact on court proceedings where cases progressed more slowly or were paused. Since then, the number of adoptions have remained around 3,000 each year, but have fallen to 2,720 in 2026.
The majority of children who were adopted start their final period of care whilst aged under 1 year - 74% - up from 72%. However, as the total number of CLA adopted has fallen this year, the number of CLA who were adopted who were under 1 when starting their final period of care has fallen by 180 children to 2,020.
On average it takes 2 years and 3 months (27 months) for a child to be adopted - the same as last year - and the average age at adoption is 3 years and 0 months - down by two months. The average time between a child entering care and being placed for adoption was 1 year and 7 months (19 months), the same as last year. It then takes a further 8 months on average for an adoption order to be granted and completed.
Further information on CLA ceasing due to adoption can be found in table E1.
CLA who left care as the subject of a special guardianship order (SGO)
The number of CLA ceasing during the year under a special guardianship order (SGO) was 3,870, down 6% on last year.
Most of the 3,870 SGOs granted were to relatives or friends (90%). The remainder were largely to other former foster carers (8%) and to other carers (2%).
The number of children leaving care as the subject of a SGO granted to former foster carers who were relatives or friends decreased by 10% to 2,520 - a decrease of 280 children - however children leaving care as the subject of a SGO granted to relatives or friends who were not former foster carers increased by 6% (60 children) to 980.
The average duration of the final period of care for CLA leaving as the subject of a SGO remains at 1 year and 9 months. However, as the average age on starting their final period of care is 4 years and 9 months, up from 4 years and 8 months, that means the average age at SGO is up slightly from 6 years and 5 months to 6 years and 6 months.
Most children who cease to be looked after under a special guardianship order were looked after under a care order - 91%.
Further information on CLA ceasing due to an SGO can be found in table E5.
17 to 21 year old care leavers
Data collected on care leavers
Local authorities provide information about young people who were previously looked after, who turned 17 to 21 in the year. These young people were CLA for at least 13 weeks after their 14th birthday, including some time after their 16th birthday. The information provided relates to contact around their birthday in the year.
‘In touch’
Local authorities are expected to initiate contact and stay in touch with care leavers aged 21 years and younger and provide statutory support to help the care leaver transition to living independently.
The proportion of care leavers whom the local authority is in touch with varies by age and has generally been stable across all ages except 17-year-olds. As these young people are less likely to be in touch with the local authority, less information is known about their activity and accommodation as a care leaver.
Activity
Information is collected on the activity that most accurately reflects the young person's main activity status on or around their birthday and figures are in the table below.
For 19- to 21- year-olds, 27% were in education (6% higher education, 21% education other than higher education) and 27% were in training or employment or an apprenticeship; 40% were not in education, employment or training (NEET) compared to an estimated 15% of all young people aged 19 to 21 years old (Source: Labour Force Survey data, percentage of young people aged 19 to 21 in England who are Not in Education, Employment or Training (NEET) during the year ending 31 March 2026).
Accommodation of former care leavers
As former care leavers get older, they tend to transition into more independent living arrangements. The most common living arrangements (on or around their birthday) are given in the table.
Most common accommodation type for 17, 18 and 19-21 year old care leavers, 2026
| Age of care leaver | Top 3 accommodation types | Percentage information not known |
|---|---|---|
| 17 years | With parents or relatives - 55% Custody - 5% Semi-independent transitional accommodation/supported lodgings/Independent living/'Other' accommodation - 2% (each) | 31% |
| 18 years | Semi-independent transitional accommodation - 38% Former foster carers - 18% With parents or relatives - 11% | 4% |
| 19-21 years | Living independently - 38% Semi-independent transitional accommodation - 20% With parents or relatives - 10% | 6% |
The full list of the accommodation that care leavers are living in can be found in table F3 .
Accommodation suitability
Information on whether care leaver accommodation is suitable can be used to monitor whether they are receiving the support they need to make a successful transition to adulthood. The decision on whether the accommodation is suitable is made by local authorities and it will depend on the circumstances of the individual case.
The proportions of young people reported by local authorities to be in unsuitable accommodation are in table F4.
“Staying Put”
The proportion of 18-year-olds in a foster placement, who ceased to be looked after on their 18th birthday and who were still living with their former foster carers 3 months after their 18th birthday ("staying put") was 63% in 2026, up from 62% last year. The proportion of 19- and 20-year-olds still living with their foster carers also was 35%, up from 33% last year.
Care leavers who were formerly UASC
For former care leavers aged 19-21-years, an increasing number and proportion were formerly UASC. This increase is due to the relatively high number of UASC since 2015 moving through the age groups and who are now care leavers.
Further information on care leavers can be found in the ‘F’ tables.
22- to 25-year-old care leavers
Data was collected for the first time in 2023 on care leavers aged 22- to 25-years-old who had been in touch with their local authority and who had requested and received support. We believe the data collected may be an undercount of the full cohort, particularly for the older care leavers, so users should take this into account when using this data.
Care leavers are assigned a Personal Advisor who will work with the young person to make sure they receive the care, support and entitlements they need when they leave care. Care leavers will have a Personal Advisor until they are at least 21 years old, and up to the age of 25 years if the care leaver chooses.
Whereas for care leavers aged 21 years and younger, the local authority is expected to initiate contact with the care leaver, they are not expected to be in touch and initiate contact with young people over age 21. This data is collected and reported (based on their latest contact during the year) and records the numbers of older care leavers who are accessing their entitlement to request support in order to better understand their activity and accommodation status.
The data shows that 60% of care leavers aged 22 years requested and received support from their local authority at some point during the year. This proportion decreases as age increases: 45% of 23-year-olds, 37% of 24-year-olds and 23% of 25-year-olds.
Further information on the activity and accommodation of 22- to 25-year-old care leavers who had requested and received support from the local authority can be found in the J tables.
Find my data and feedback
To find information on topics of interest, expand the content sections, for example ‘CLA on 31 March’ or ‘17 to 21 year old care leavers’. In each section, there will be summary commentary and related tables/charts. You can also create your own tables through the table tool or modify the pre-prepared tables which use the same files.
At the top of the release, there is a link ‘download associated files’ which includes the data and metadata that sits underneath the release. There are also links under ‘related guidance’ at the top right-hand side of the release. These will direct you to the statistics methodology document, the latest data collection guide, the EES glossary and previous statistical releases in this series.
The standard period for data in the release is for the year ending 31 March 2022 to the year ending 31 March 2026. Users wishing to access time series longer than the published five years may refer to the equivalent tables in earlier statistical releases in this series. The data set ‘Time series of children looked after data - 1994 to 2026 - NATIONAL’ includes longer time series data from 1994 for children looked after, and for unaccompanied asylum seeking-children a time series from 2004. Figures for CLA back to 1965 are available in the annex of the methodology document for this release.
The children’s social care dashboard (opens in new tab) includes a selection of children looked after statistics that are used to measure progress towards the outcomes in the children’s social care national framework. The dashboard allows users to view progress nationally, regionally and by local authority. Links to other related statistical publications on children's social care can be found in the methodology document that accompanies this release.
Feedback
Your feedback is important to help us improve and develop. To provide feedback on this release, content, or functionality, and for any other queries, please contact the CLA statistics mailbox. Email: CLA.Stats@education.gov.uk
Contact us
If you have a specific enquiry about Children looked after in England including adoptions statistics and data:
Looked-after children statistics team
Email: cla.stats@education.gov.ukContact name: Justin Ushie
Press office
If you have a media enquiry:
Telephone: 020 7783 8300
Public enquiries
If you have a general enquiry about the Department for Education (DfE) or education:
Phone: 0370 000 2288
Opening times
Monday to Friday from 9.30am to 5.30pm (closed on bank holidays)