Update to reflect clarified terminology describing how user input was collected. No statistical content has changed.
Confirmation of discontinuing publication
Update to invitation for feedback
Methodology note for Graduate Labour Market Statistics, 2023
Introduction
This methodology contains supporting information for the statistical release Graduate Labour Market Statistics (GLMS), including further detail on the background of the publication, data source, data processing and data quality of these statistics overall.
The R code used to produce the data for the publication is available for access via GitHub (opens in new tab).
GLMS was first published by the Department for Business, Innovation and Skills (BIS) in December 2014 on a quarterly and annual basis. Following a consultation, the publication was reduced to annually from the April 2016 release. Responsibility for English Higher Education policy, and hence this publication, transferred to the Department for Education (DfE) in Summer 2016.
GLMS uses the Office for National Statistics’ (ONS) Labour Force Survey (LFS) data to look at the labour market outcomes of graduates, postgraduates and non-graduates. Due to the devolution of higher education policy, only individuals domiciled within England are considered, though note that English-domiciled graduates may have received their degrees from institutions outside England.
Other publications on graduate employment and earnings
The Department for Education and other bodies have also published research on the absolute, and lifetime returns to undergraduate degrees. For more detailed econometric analysis of the earnings and employment differentials between graduates and non-graduates, please see the links below:
The Department for Education have decided to discontinue publication of Graduate Labour Market Statistics. This is in part due to ongoing limitations on the quality and availability of data in the Labour Force Survey, as well as following regular review of the statistics presented in this release to ensure they continue to meet user needs. We have determined that more robust statistics are produced elsewhere using different data sources.
We have identified that similar statistics on the employment and earnings of graduates are largely available from the following sources:
LEO Graduate and Postgraduate Outcomes publishes employment and earnings statistics on graduates and postgraduates by cohort. Full population coverage on all graduates and postgraduates is used to produce statistics on employment and earnings 1, 3, 5 and 10 years after graduation. We have assessed this more recent statistical series to be more robust.
Graduate Outcomes Survey (opens in new tab) produced by the Higher Education Statistics Agency (HESA). HESA survey students 15 months after graduation covering qualification NQF levels 4 to 8. Estimates are available on employment, earnings and further study.
The table below summarises the statistics presented in GLMS and where similar statistics can currently be found:
Graduate high-skilled employment rate by ethnicity
/
Graduate inactivity rate by ethnicity
x
Graduate unemployment rate by ethnicity
~
/
Graduate employment rate by disability status
~
/
Graduate high-skilled employment rate by disability status
/
Graduate inactivity rate by disability status
x
Graduate unemployment rate by disability status
~
/
Graduate employment rate by degree class
~
/
Graduate high-skilled employment rate by degree class
/
Graduate inactivity rate by degree class
x
Graduate unemployment rate by degree class
~
/
Part-time employment by graduate type
/
Part-time employment by graduate type and age
/
Part-time employment by graduate type and sex
/
Median nominal salaries by graduate type and sex
~
Median real salaries by graduate type and sex
~
Graduate nominal salaries by sex and industry
/
Key
/ - already available
~ - possible in future publications
x - not available/possible elsewhere
Statistics not currently available elsewhere:
Non-graduate employment rates and earnings estimates – our LEO publication, to be published in June 2026, will include comparative statistics for non-graduates with breakdowns by prior academic attainment and other student characteristics.
Inactivity rates – these are not available elsewhere. We received limited feedback on the value of these statistics.
Discontinuing the Graduate Labour Market Statistics publication will give us the opportunity to improve our LEO publication, which provides more robust statistics on the employment and earnings of graduates, postgraduates and non-graduates (to be added in 2026).
Please see summary of feedback received from users:
Feedback
Response
Loss of timeseries
LEO data is available from tax year 2016/17 and Graduate Outcomes Survey data is available from academic year 2017/18.
Limitation of LEO data not including hours worked to inform difference in earnings
LFS data will be used to adjust LEO statistics on earnings in the 2026 publication.
Need for earnings data by graduate type by prior attainment
This will be included in the LEO publication in 2026.
LEO provides estimates of annualised earnings data from combined PAYE for employees and self-assessment records for the self-employed, rather than the salary data used in the GLMS publication based on annualised gross weekly salary (LFS)
LEO 2026 will provide estimates of full-time equivalent salary data as well as annualised earnings.
Graduate statistics produced by government should be interpreted with an understanding that education is one of many factors influencing pay outcomes. Comparisons of average salaries between graduates and non‑graduates can oversimplify these relationships, so findings should be considered in the context of wider contributing factors.
The LEO 2026 publication will include a comparison of graduate and non-graduate earnings. The design of this has been consulted on with a wide variety of sector stakeholders and academics and is being based on that feedback. In particular, it will likely not present a single overall earnings difference but instead stratify by prior attainment and sex.
No current source or publication will provide all factors driving salary potential
The LEO 2026 publication aims to provide breakdowns of key factors which impact earnings, such as the addition of an adjustment for hours worked. The publication will make clear the limitations of the analysis and that not all factors can be considered.
Please note the methodology for the GLMS has been updated for the 2024 publication. The main changes relate to:
Data
LFS response rates have improved for the 2024 release compared to GLMS 2023, following the introduction of a ONS recovery plan for the LFS at the end of 2023. New 2024 population re-weighting has also been applied (see the Data source section).
Analysis
The naming of some of variables in the R code for GLMS have changed to make the data output files more relevant to users.
Weighted median methodology has been updated for GLMS 2024. The latest approach uses linear interpolation to calculate annual median salaries (both nominal and real salaries).
The GLMS publication has previously reported a 'graduate premium' (the difference in average salaries of graduates and non-graduates) with caveats around the interpretation of this value due to the limitations in the available data. These limitations include the inability to control for external factors which can influence salary, such as prior academic attainment, in the available data. Therefore, a direct comparison in salary between postgraduates, graduates and non-graduates based on this data has been advised with caution. The 2024 release does not use the term ‘graduate premium’ to avoid any confusion in interpreting these statistics; however, the data can still be compared by users, and we have caveated the limitations in doing so.
Therefore, statistics produced in the 2024 publication will differ from previous years’ publications, and care should be taken when making comparisons as the back series has changed.
GLMS is produced using data from the UK quarterly Labour Force Survey (LFS) – an ONS survey of households living at private addresses in the UK. Its purpose is to provide information on the UK labour market which can then be used to develop, manage, evaluate, and report on labour market policies. For more information on the methodology and quality of the LFS data please refer to the user guidance (opens in new tab). Further details on LFS weighting can be found below in the Weighting section.
Response Rate
ONS have faced challenges around the falling number of responses to the LFS, which has led to increased sampling variability.
This increase in the volatility in the estimates of employment, unemployment, and economic inactivity led to ONS suspending the usual suite of LFS-based labour market statistics from October 2023 through to January 2024. At the end of 2023 ONS applied a recovery plan which has seen both response rates and LFS person datasets increasing and providing more robust measures of economic activity. Further improvements were implemented in 2024, including a review of the LFS weighting approach and ONS expects the full benefits of these improvements to feed through to the LFS by Q1 2025. Data has been re-weighted from Q1 2019 onwards using the latest 2024 population weights which has led to changes in the GLMS 2024 back series for earlier years, and comparisons of levels prior to this period should be viewed with caution. Full details of the reweighting can be found here: Impact of reweighting on Labour Force Survey key indicators - Office for National Statistics (ons.gov.uk) (opens in new tab)
Though the implementation of the recovery plan has improved the quality of the 2024 LFS outputs, main wave 1-5 datasets are still considerably smaller than those of pre-pandemic levels. The latest LFS achieved sample for the UK was around 28,000 households and 63,000 people for Q4 2024. This compares to almost 36,000 households and 84,000 people achieved in Q4 2019 before the start of the COVID pandemic.
Improvements will take time to materialise in the LFS data; therefore they remain "official statistics in development" until further review.
Accuracy
As the results presented in these publications are based on survey data, they are estimates. Individual estimates may be inaccurate reflections of the true population, and differences between estimates may not be statistically significant. This is particularly true for estimates calculated from small group sizes. To take account of this, proportions where numerators are based on 30 or less are flagged, and particular care should be taken when interpreting these results.
For GLMS 2024, the accuracy flags for employment rates provided in the downloadable CSV files show how many of the four LFS quarters of each calendar year have numerators that were based on underlying sample sizes of 30 or less:
Where the employment accuracy flag i.e. employment_rate_accuracy has a value of ‘0’, this indicates that none of the underlying LFS quarters used in the calculation of the employment rate were based on sample sizes of 30 or less.
If an employment accuracy flag has a value of either ‘1’, ‘2’, ‘3’ or ‘4’, this indicates that either 1, 2, 3 or 4 of the underlying LFS quarters had a sample size of 30 or less when calculating the employment rate.
An accuracy flag of ‘4’ would suggest that the employment rate would be subject to higher sampling variability in the calculation.
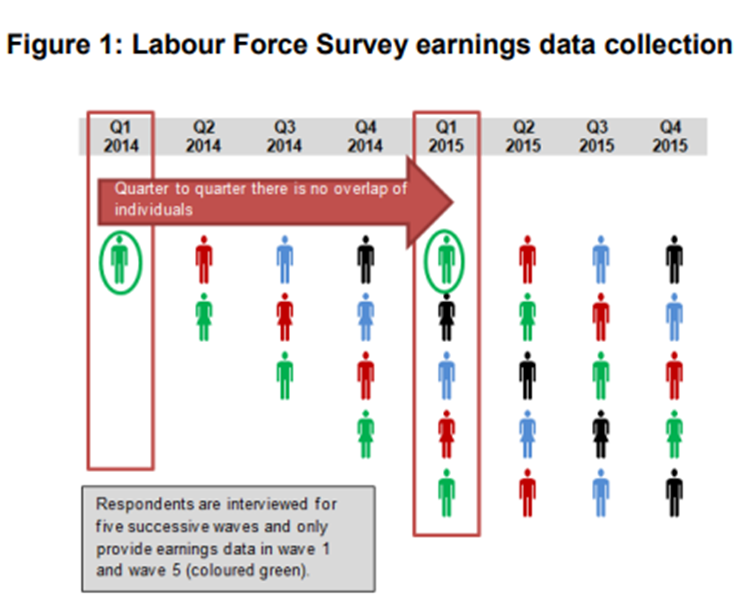
Accuracy flags for annual earnings estimates, e.g. ‘median_salary_accuracy’, are based on a total annual sample size, rather than for individual quarters, given that LFS respondents only report earnings once in a calendar year (see Figure 1 ).
Coverage
GLMS only covers English domiciled individuals (those whose permanent home is in England) as authority over higher education has been devolved to Scotland, Wales and Northern Ireland. Individuals domiciled in England may still have received graduate or postgraduate qualifications from institutions outside England.
Weighting
The LFS collects information on a sample of the population. To enable us to make inferences from this sample to the entire eligible population we must apply weights to the sample data. This entails assigning each responding or imputed case a weight, which can be thought of as the number of people in the population which that case represents. These weights are calculated such that they sum to a set of known population totals, and the weights of an entire dataset will sum to the eligible population of the UK. For further information on LFS weighting please refer to the user guidance (opens in new tab).
Labour Force Survey (LFS) datasets are routinely reweighted in line with population estimates.
In 2018, a new weighting variable was introduced, PWT18, applying to LFS datasets from July-September 2011 onwards.
In 2021, a further reweighting was applied to the LFS, with 2020 (PWT20) population weights being applied to both the 2020 and the 2021 LFS quarterly data. This weight was used in the 2021 publication.
In 2022, a further reweighting was applied to the LFS, with 2022 (PWT22) population weights applied to quarterly data since Q1 2020, superseding the previous PWT20 population weights. Care should therefore be taken when comparing across previous publications, as updated weights have been applied for the 2022 publication, meaning outputs for 2020 and 2021 will differ slightly to previous publications. This latest weight uses updated population data to better reflect changes in international migration and other impacts as a result of the coronavirus (COVID-19) pandemic.
However, in 2023, for calendar quarters from Q3 2022 onwards, 2023 population weights (PWT23) were applied to the LFS. This change was implemented because of the increase in the sample variability and volatility in the estimates of employment, unemployment and inactivity leading to the suspension of the LFS based labour market statistics from October 2023 to January 2024. In addition, there was a review of the LFS weighting approach, which led to the re-weighting change being applied.
In 2024 to align with the ONS recovery plan to improve the robustness of the LFS, the latest weights available, PWT24, have been applied for the period Q1 2019 to Q4 2024.
The reweighting project completed by the Office for National Statistics has also resulted in the following revisions to the GLMS:
The results from Q1 2019 onwards have been re-calculated using the new 2024 LFS population weights.
The results from Q3 2011 up to Q4 2018 have been calculated using the 2018 LFS population weights.
The results for the years 2007 up to Q2 2011 have been calculated using the 2014 LFS population weights.
The effect of the change in weighting is generally negligible. For the 2023 publication, the effect of reweighting cannot be isolated from changes associated with the regrouping of graduates, postgraduates and non-graduates, but we expect a similar scale of effect.
GLMS only provides simple outcome measures based on survey data and does not control for the differences in characteristics between graduates, postgraduates, and non-graduates. This means that the outcomes reported may not be wholly attributable to the fact that an individual holds a particular qualification, but instead could reflect other factors, such as regional variations, prior academic attainment, parental background, sex, innate ability, previous skills and experience, or ethnicity.
Revisions policy
There may be changes to the GLMS publication should there be any changes to the LFS questions or coverage, or changes in population weights as recommended by the ONS. Any changes to the GLMS will be explained in an update to the methodology.
To produce these statistics, extensive data processing has been carried out which is detailed below.
Conversion of quarterly data for the annual publication
Respondents to the LFS are interviewed for five successive waves at three-monthly intervals and 20% of the sample is replaced every quarter. Employment status is reported in each wave. All rates in the GLMS (employment rates, high skilled employment rates, unemployment rates, inactivity rates and the proportion of part-time workers) are calculated for each quarter of LFS data, and then the mean of the four quarters is taken to generate an estimate for annual rate, thus accounting for seasonality over the year.
Where any of the numerators used for the calculation of quarterly rates are 30 or less, this is flagged in the CSV files using accuracy flags. This shows the number of quarters within each calendar year where this occurs (e.g. an accuracy flag of “1” indicates that the rate for one of the four quarters used to calculate a yearly rate had a sample size of 30 or less). A quarterly rate calculated from such a small group size may be unreliable and could skew the mean for the year. Rates flagged in this way should be treated with caution.
Respondents only provide earnings data in waves 1 and 5 of the survey. This means that each individual only reports their earnings once in any given calendar year, as Figure 1 demonstrates.
Given that salary data is only collected in one quarter of each given year there is no risk of double counting the salary data of respondents when generating an annual median salary. Therefore, all median salary calculations in the GLMS give the weighted median of all salary data collected for the specified population over the four quarters of data, thus accounting for seasonality over the year. Although the LFS has a slightly larger sample size in Q2, meaning that marginally more weight is placed on salary data in this quarter when calculating the annual median salary, the benefit of a much larger sample size outweighs this small discrepancy.
We flag medians that are calculated from annual sample sizes of 30 or less, and these should be treated with caution. The median is not susceptible to distortion by extreme values, but estimates may be shifted away from the population median if the group is unrepresentative, and this risk is higher as group size decreases. Medians calculated from 4 or fewer respondents are suppressed for disclosure control.
The main impact of the amendments to this variable regarding the GLMS is the addition of the degree apprenticeship and graduate apprenticeship categories. This, alongside other variable changes, has required a wide-ranging revision to our approach for allocating individuals to the main classification groups of graduates, postgraduates and non-graduates (see below). To ensure consistency across the time series, we have also reviewed allocation across previous years in the back series and this has resulted in small changes.
1. Graduates, postgraduates and non-graduates
Graduate – defined as individuals whose highest qualification is an undergraduate degree at Bachelor’s level. This category also includes those classified as graduates who are currently enrolled in education courses, including studying towards a Master’s or PhD. As of 2022, this also includes individuals with ‘degree apprenticeships’ or ‘graduate apprenticeships’ equivalent to a first degree. If, in the LFS data, an individual has a higher degree and “NA” or “don’t know” in the detailed higher education variable (HIGHO), indicating uncertainty over their higher qualification, but have a first degree in the detailed degree type multi-response variable (DEGREE7), they have been categorised as a graduate.
Postgraduate – defined as individuals whose highest qualification is any degree higher than an undergraduate degree, such as a Master’s or PhD. This category also includes those who have attained a Postgraduate Certificate in Education, as well as those in the category “other postgraduate degrees or professional qualifications”. As of 2022, this also includes individuals with ‘degree apprenticeships’ or graduate apprenticeships’ equivalent to a higher degree. Individuals with a higher degree but “NA” or “don’t know” in the detailed higher education LFS variable (HIGHO), and no first degree in the detailed degree type multi-response variable (DEGREE7), are excluded from this analysis due to uncertainty over their qualification.
Non-graduate – defined as individuals whose highest qualifications are at a lower level than an undergraduate degree (National Qualification Framework (NQF (opens in new tab)) Level 5 or below). This includes individuals with Foundation Degrees, Apprenticeships, A-Levels or GCSEs as their highest qualification, as well as people with lower or no qualifications. It also includes non-graduates who are enrolled on education courses, such as A-level qualified individuals who are at studying at university. As of 2022, undefined nursing and teaching qualifications have also been included within the non-graduate category.
Individuals whose highest qualification is at Level 6, 7 or 8 but is not classified as an undergraduate or postgraduate degree in the LFS are not considered as part of this analysis.
Where there is ambiguity over the education level of an individual, they are excluded from this analysis. As a result, the non-graduate group has decreased since the 2021 publication as the number of individuals defined as not in scope, and therefore excluded from the analysis, has increased. Care should therefore be taken when comparing across publications. For a list of qualifications included in each definition please see Annex A.
It should be noted that the definitions of graduates and non-graduates in the GLMS differ from those used in other publications which focus on graduate outcomes, such as the Department for Education’s LEO Graduate and Postgraduate Outcomes and HESA’s Graduate Outcomes (opens in new tab). The LEO publication refers to graduates as those that graduated with a first degree from an HE provider in England. In contrast, the HESA Graduate Outcomes has much wider coverage and includes those that graduated with at least level 4 qualifications in the UK, but not FE colleges in Scotland or Scottish Alternative Providers. The statistics in this release are not directly comparable with those publications due to the differences in definitions.
2. Population
The LFS is weighted so that outputs are representative of the general population. In the GLMS we use the latest weights for any given year to report outcomes for the specified populations of interest. Outcomes are presented for two different age groups:
Working age population – all individuals domiciled in England aged 16-64.
Young population – all individuals domiciled in England aged 21-30.
GLMS provides a breakdown of outcomes for a ‘young’ sub-population. This is to reflect the fact that the large majority (over 80%) of those that qualified from an undergraduate course in 2020/21 at a UK HE provider (at either NQF levels 4,5 or 6) were under the age of 30, see HESA (opens in new tab) for more information. New entrants to the labour market are likely to have a limited amount of work experience, so analysis of this sub-group allows comparisons between similarly aged graduates and non-graduates.
3. Employment
Employed – individuals that had at least one hour of paid employment in the reference week. This includes individuals that worked full time or part time.
High-skilled employment – the proportion of the total specified population who report being in high skilled employment. High-skilled employment is defined as a job categorised within the Standard Occupation Classification (SOC 2020 (opens in new tab)) codes 1-3. SOC 1-3 includes managers, directors and senior officials; professional occupations and associate professional occupations (this is the same definition as used by Office for Students in their B3 progression metric (opens in new tab)).
The high-skilled employment rate presented in GLMS is not the proportion of those employed that are in a high-skilled job; it is the proportion of all graduates that are in a high skilled job. For example, a high-skilled employment rate for working age graduates of 70% would mean that 7 out of 10 of all graduates aged 16-64 were in a high skilled job.
Note that in releases of GLMS prior to 2021, previous SOC classifications were used. The re-classification of SOC in the GLMS 2021 release means that there is a discontinuity in the GLMS series, and care should be taken when comparing with previous publications.
Medium/low-skilled employment – a job categorised within the Standard Occupation Classification (SOC 2020) codes 4-9. SOC 4-9 includes administrative and secretarial occupations; skilled trades’ occupations; caring, leisure and other service occupations; sales and customer service occupations; process, plant and machine operatives and elementary occupations.
Unemployed – individuals that were not in employment during the reference week and were actively seeking work.
Inactive – also known as the economically inactive, these are individuals that were not employed and did not seek work over the reference period or were seeking work over the reference period, but were unavailable to start work (for example graduates undertaking further study).
Employment rate – the proportion of the total specified population who are employed.
Unemployment rate – the proportion of the specified economically active population (i.e. in work or unemployed) who are unemployed. This excludes individuals who are economically inactive. Unemployment is defined under the International Labour Organization (ILO) measure, which assesses the number of jobless people who want to work, are available to work and are actively seeking work. This is consistent with the ONS definition of unemployment.
Inactivity rate – the proportion of the total specified population who report being economically inactive in the labour market.
Proportion of part-time workers - the proportion of the total specified population who report that they work part time. The total population is comprised of individuals who report that they work either full time or part time (i.e. not including those who are unemployed or inactive).
4. Salaries
Please note that statistics presented on salaries are crude estimates, and differences among the graduate groups are not purely attributable to level of education obtained. Other factors, such as region and prior academic attainment, will influence earnings.
Median salaries are calculated as the annual equivalent of the weighted median gross weekly earnings of individuals who are in full-time employment, including overtime pay. Salaries only include earnings from individuals’ main jobs (GRSSWK in the LFS). This metric should thus be considered reflective of full-time earning power rather than total income from all jobs.
Individuals working on a part-time basis are not included in the earnings analysis.
Salaries are rounded to the nearest £500, in line with HESA’s Graduate Outcomes statistics.
Annual salaries across the time series have been adjusted to account for inflation and reflect real-time earnings. We publish time series for both nominal and real salaries. For the 2024 publication of GLMS, these have been calculated using the March 2025 edition of ONS Consumer Prices Index (opens in new tab) including owner occupiers’ housing costs (CPIH). Adjustment is made to GRSSWK using the quarterly deflators with base 100 set at the calendar year 2007. This inclusion is particularly relevant because of recent inflationary pressures including the impact of COVID pandemic from 2020, the war in Ukraine from 2022 and the recent cost of living crisis.
Median salaries in the GLMS 2024 that are not adjusted for inflation are given in ‘nominal’ terms. Median salaries that are adjusted for inflation are given in ‘real’ terms. The time series median salaries data is presented in both nominal and real terms, however, the median salaries by industry is only given in nominal terms.
5. Personal characteristics of graduates
GLMS provides detail on the employment and earnings outcomes of graduates by specific characteristics that are available in the LFS data. The breakdowns included are age group, gender, ethnicity, disability status, degree class, subject group (in the data tables only), occupation and industry.
Age groups – 21-30 year olds; 31-40 year olds; 41-50 year olds; 51-60 year olds.
Gender – Female; Male.
Ethnicity – Asian / Asian British; Black / African / Caribbean / Black British; Other ethnic group; White.
Asian is defined in the LFS as ‘Asian or Asian British’. Black is defined in the LFS as ‘Black or African or Caribbean or Black British’. Other combines three groups within the LFS; ‘Mixed or Multiple ethnic groups’, ‘Arab’ or ‘Other ethnic group’.
From GLMS 2023, ‘Chinese’ has been included in the ‘Asian or Asian British’ group, whereas in previous publications it was included in the ‘Other ethnic group’. Other has been combined together at the disaggregated level as the sample sizes were insufficient for robust analysis. The ‘Other ethnic’ group includes graduates from a wide range of ethnic backgrounds. This category has been included for completeness within the data. However, there is likely to be a high level of variation between graduates in this group and caution should be exercised when making comparisons with this group.
Disability status – Disabled; Not Disabled.
This breakdown is based on the legal definition found in the Equality Act (2010) which defines a disability as “a physical or mental impairment which has a substantial and long-term adverse effect on your ability to carry out normal day-to-day activities”.
Degree class – First; Upper second (2:1); Lower second (2:2); Third.
Data from HESA shows that the percentage of first degree qualifiers from UK HE providers has been changing recently. 28% obtained a first class degree in 2017/18, rising to 37% in 2020/21, but fell to 29% in 2023/24. The proportion of first degree qualifiers with an upper second was 49% in 2017/18 and fell slightly to 48% in 2023/24.
Occupation –
High-skilled employment (SOC1-3) includes Managers, directors and senior officials (SOC 1); Professional occupations (SOC 2); Associate professional and technical occupations (SOC 3)
Medium-skilled employment (SOC 4-6) includes Administrative and secretarial occupations (SOC 4); Skilled trade occupations (SOC 5); Caring, leisure and other service occupations (SOC 6)
Low-skilled employment (SOC 7-9); includes Sales and customer service occupations (SOC 7); Process, plant and machine operatives (SOC 8); Elementary occupations (SOC 9)
Please note that due to small samples from disaggregating the data (i.e. by gender), estimates can be volatile over time and should be viewed with caution.
Throughout the publication, all rates provided are rounded to one decimal place, while annualised median salaries are rounded to the nearest £500. Suppression is applied to both rates or salaries based on sample sizes of 4 or less within each calendar year.
It is possible that the sum of the category percentages may not always total to 100%. For example, within the tables or CSV files in the publication, the sum of the employment rate, unemployment rate and inactivity rate may not equal 100% due to rounding and because they are based on averaged (mean) figures over four different calendar quarters from the LFS.
Annex A: List of qualifications within each graduate type
Postgraduate
Master’s Degree. As of 2022 this now includes those who have attained the equivalent of a higher degree via an apprenticeship
PhD or Doctorate
Postgraduate Certificate in Education (PGCE)
Other Postgraduate Degree or Professional Qualification
Graduate
Bachelor’s Degree, also referred to as first degrees. As of 2022 this now includes those who have attained the equivalent of a first degree via an apprenticeship
Non-Graduate
Examples:
Foundation Degrees (NQF Level 5) and ‘other’ degrees
Professional Diplomas, Certificates or Awards at Levels 6, 7 or 8 where there is uncertainty over whether an individual has gained an undergraduate or postgraduate degree
Any other individual where the education level is unclear, for example but not limited to:
those with a higher degree but no detail surrounding the exact qualification
those with a graduate membership of a profession but no detail surrounding the specific degree level
Undergraduate degrees that are not either first degree or foundation degree level