Student loan forecasts - earnings
Ad hoc experimental statistics publication presenting analysis of earnings and lifetime repayments forecasts for England
Quick links
- Published
Headline facts and figures
Plan 2 borrowers would need to earn
£63,600
in financial year 2026-27 to see a balance of £52,100 decrease
why a balance of £52,100?
The current mean average balance of all Plan 2 borrowers is £52,100.
Plan 5 borrowers would need to earn
£43,625
in financial year 2026-27, to see a balance of £45,800 decrease
why a balance of £45,800?
Plan 5 borrowers starting in academic year 2025/26 are forecast to reach SRDD with a mean average loan balance £45,800 https://explore-education-statistics.service.gov.uk/find-statistics/student-loan-forecasts-for-england/2025-26
Of Plan 2 borrowers within the projected earnings band of
£45k - £50k
and above annually, 5 years after SRDD, at least half are forecast to fully repay their loans
note on the Plan 2 borrower subpopulation
This relates to a subpopulation of borrowers which is defined within this report. We forecast 50% of Plan 2 borrowers earning between £45k and £50k 5 years after graduation to fully repay their loan.
Of Plan 5 borrowers within the projected earnings band of
£25k - £30k
and above annually, 5 years after SRDD, at least half are forecast to fully repay their loans
note on the Plan 5 borrower subpopulation
This relates to a subpopulation of borrowers which is defined within this report. We forecast 56% of Plan 5 borrowers earning between £25k and £30k 5 years after graduation to fully repay their loan.
- SRDD is the Statutory Repayment Due Date. This is the date from which a borrower is liable to make repayments
- All figures given in financial years
- These headline figures are based on higher education undergraduate borrowers in England only
About this release
This ad hoc statistical publication is a one-off release presenting analysis on the relationship between borrower earnings and loan repayments.
This analysis is based on models developed by the Department for Education (“the Department”). Details of key caveats are provided in the Key Limitations and Methodology Notes section of this publication and details of the methodology used in the Department’s core student loan forecast models are included alongside the Student Loan Forecasts for England publication (Release home - Student loan forecasts for England - Explore education statistics - GOV.UK).
We welcome feedback on this publication at he.modelling@education.gov.uk.
Introduction
Student loans are income-contingent, so a borrower’s obligatory repayments are linked to their earnings. This means that the ability of a borrower to repay their student loan is also linked to their earnings. Borrowers make obligatory repayments as a set percentage of their earnings above a set threshold, dependent on their student loan plan type.
This publication presents three areas of new analysis, to improve transparency around repayment of loans:
- Annual earnings required to reduce student loan balances.
- The proportion of borrowers forecasted to fully repay their student loan, within set annual earning income bands (3, 5 and 10 years after becoming liable to repay their student loan) for a simplified subpopulation of borrowers.
- Illustrative borrower earnings pathways and impact on student loan balances.
For the borrower population included in this analysis (see Borrower Population section for full details), through this new analysis we find that:
- A Plan 2 borrower with a current average loan balance of £52,100 would need to earn £63,600 in financial year 2026-27 to see their balance decrease.
- A Plan 5 borrower with a loan balance of £45,800 (the forecast average debt at SRDD for a Plan 5 borrower starting their course in 2025/26) would need to earn £43,625 in financial year 2026-27 to see their balance decrease.
- To be more likely than not to fully repay their loan balance, a Plan 2 borrower needs to earn at least £45,000 - £50,000 5 years after their SRDD. A Plan 5 borrower would need to earn at least £25,000 - £30,000 5 years after their SRDD based on forecasting models accounting for a wide range of earnings profiles. Note the borrowers used for this analysis are a simplified subpopulation as outlined in the Key Limitations and Methodology Notes.
- Earnings will vary a lot between borrowers, even where two borrowers earn similar amounts at a given point in their careers, so earnings at a given point in time are somewhat limited on their own as a predictor of whether a borrower fully repays.
Key limitations and filters used in producing the analysis presented here can be found in the limitations section.
Earnings required to reduce loan balances
The amount a borrower needs to earn to reduce their loan balance in a given year is dependent on the size of their balance and the interest rate being charged. The interest rate is driven by the borrower's plan type so we have explored each plan type separately. The analysis presented in this section highlights the relationships between earnings, loan balance and change in balance within a given year for Plan 2, Plan 3 and Plan 5.
To note: All figures within this section represent calculations applying repayment rules rather than model outputs, so do not use the core repayment forecasts as outlined in the Key Limitations and Methodology Notes section. Figures include the impact of the 6% cap on Plan 2 and Plan 3 interest rates for academic year 2026/27.
They update and expand on figures produced by the Institute for Fiscal Studies in Figure 5 of How do Plan 2 student loans work, and how have they changed over time? | Institute for Fiscal Studies (opens in new tab). Interest rates are set for borrowers across academic years, whereas earnings and repayment thresholds are set out in financial year terms. This means no borrowers on any plan type will necessarily be charged a single interest rate for the whole financial year. Interest rates have been smoothed to an effective financial year rate.
Figure 1.1: Change in outstanding loan balance based on annual earnings for Plan 2 borrowers in financial year 2026-27
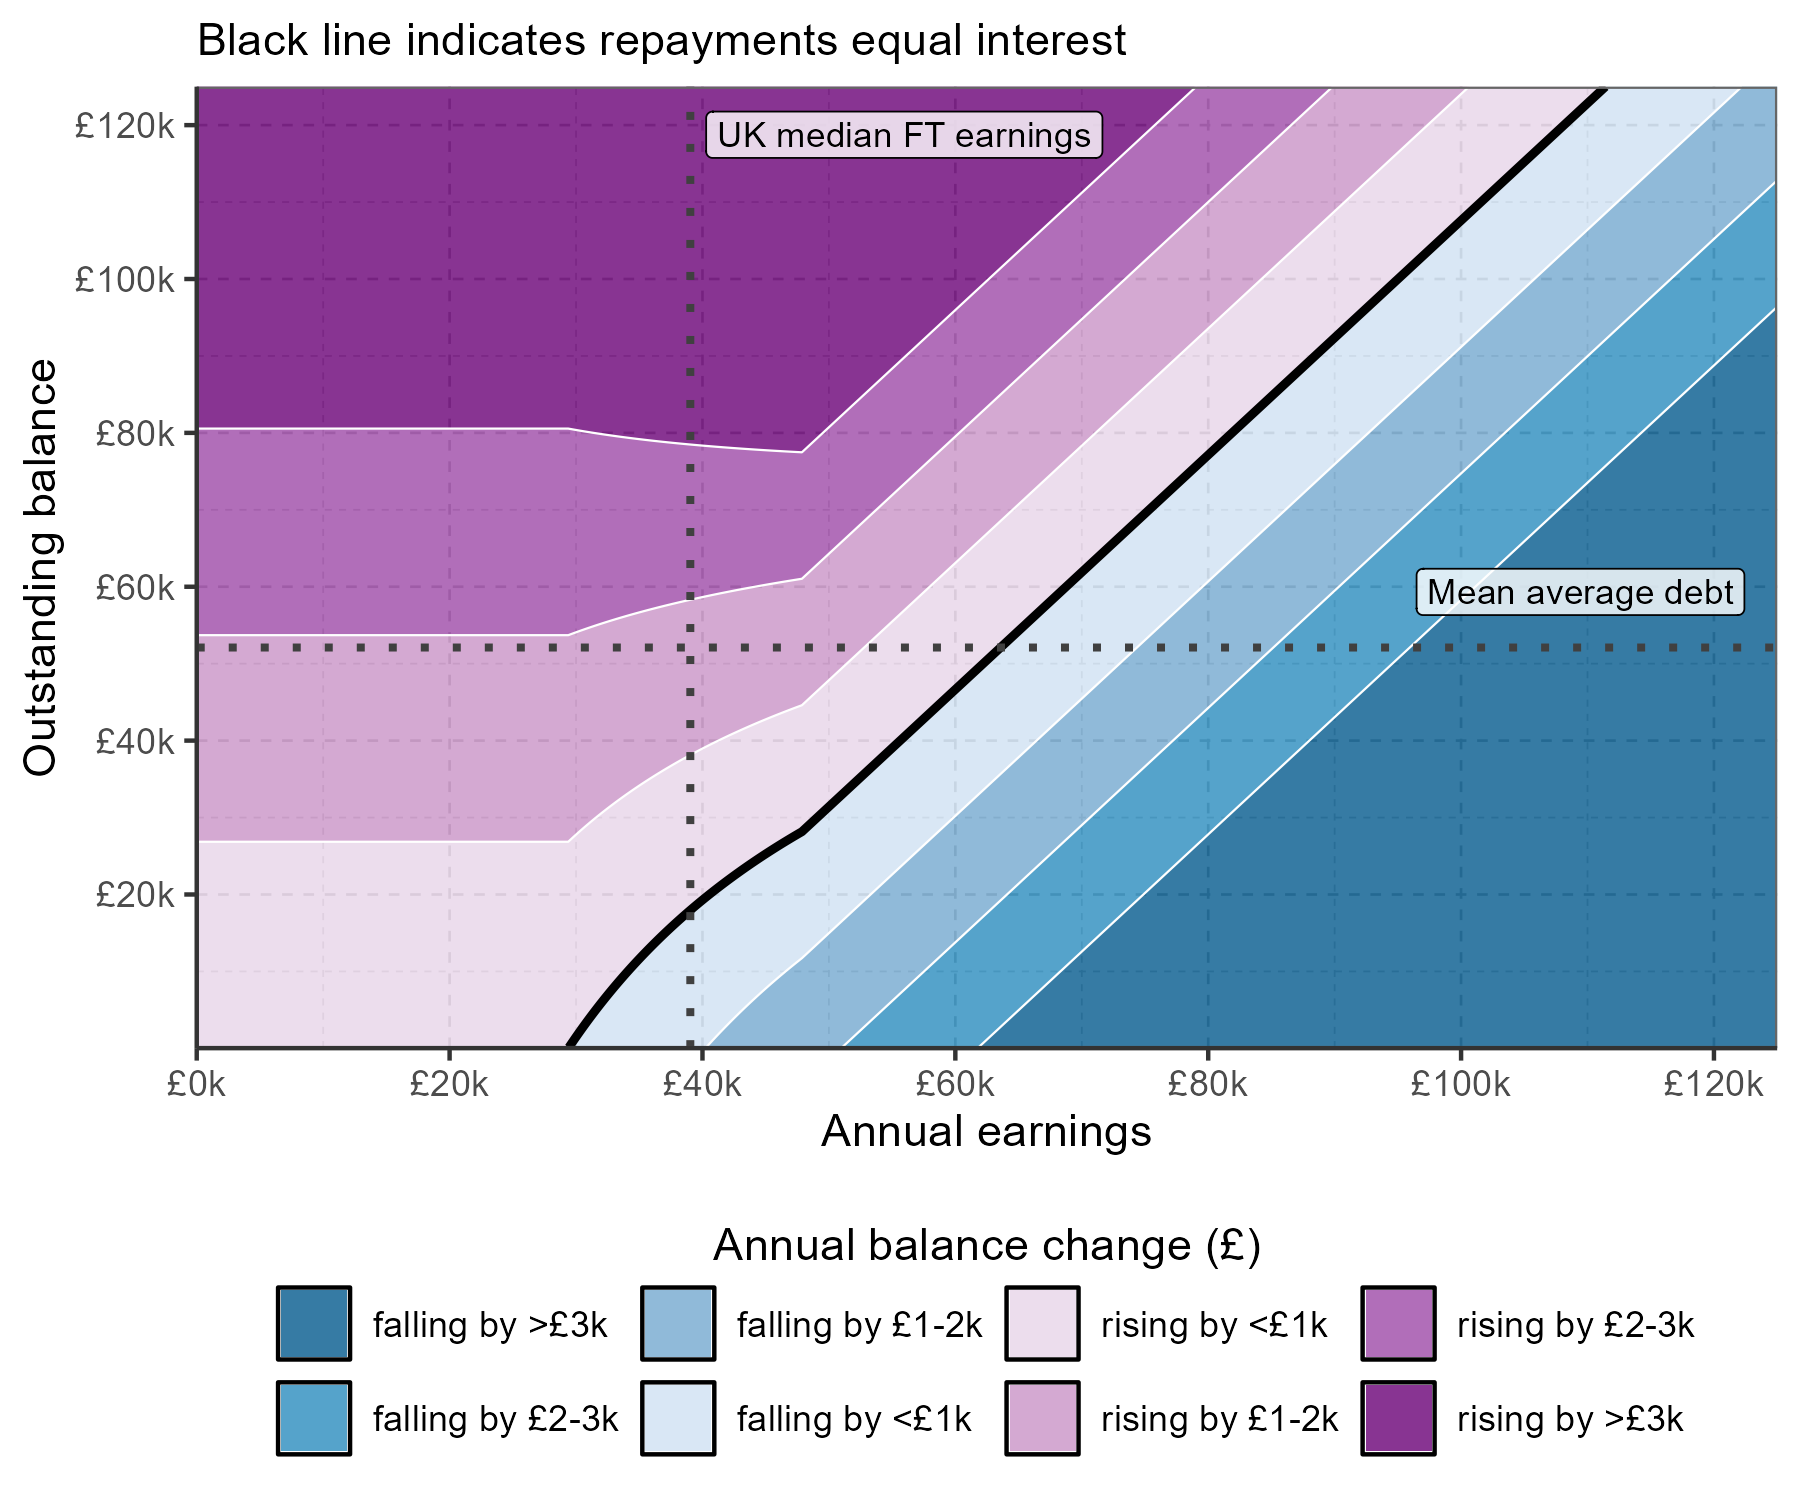
Figure 1.1 shows that a borrower with a loan balance of £52,100 (the current mean average debt for all Plan 2 borrowers), earning the UK’s median average salary for full-time employees in financial year 2025-26 of £39,039 (Employee earnings in the UK - Office for National Statistics (opens in new tab)), would see their loan balance increase by £1,692 per year.
The nonlinearity seen in Figure 1.1 reflects the variable interest rate for Plan 2 borrowers - between the lower and upper Plan 2 thresholds, both interest rates (due to the income-dependent portion of Plan 2 interest rates) and total repayments grow.
Figure 1.2: Change in outstanding loan balance based on annual earnings for Plan 5 borrowers in financial year 2026-27
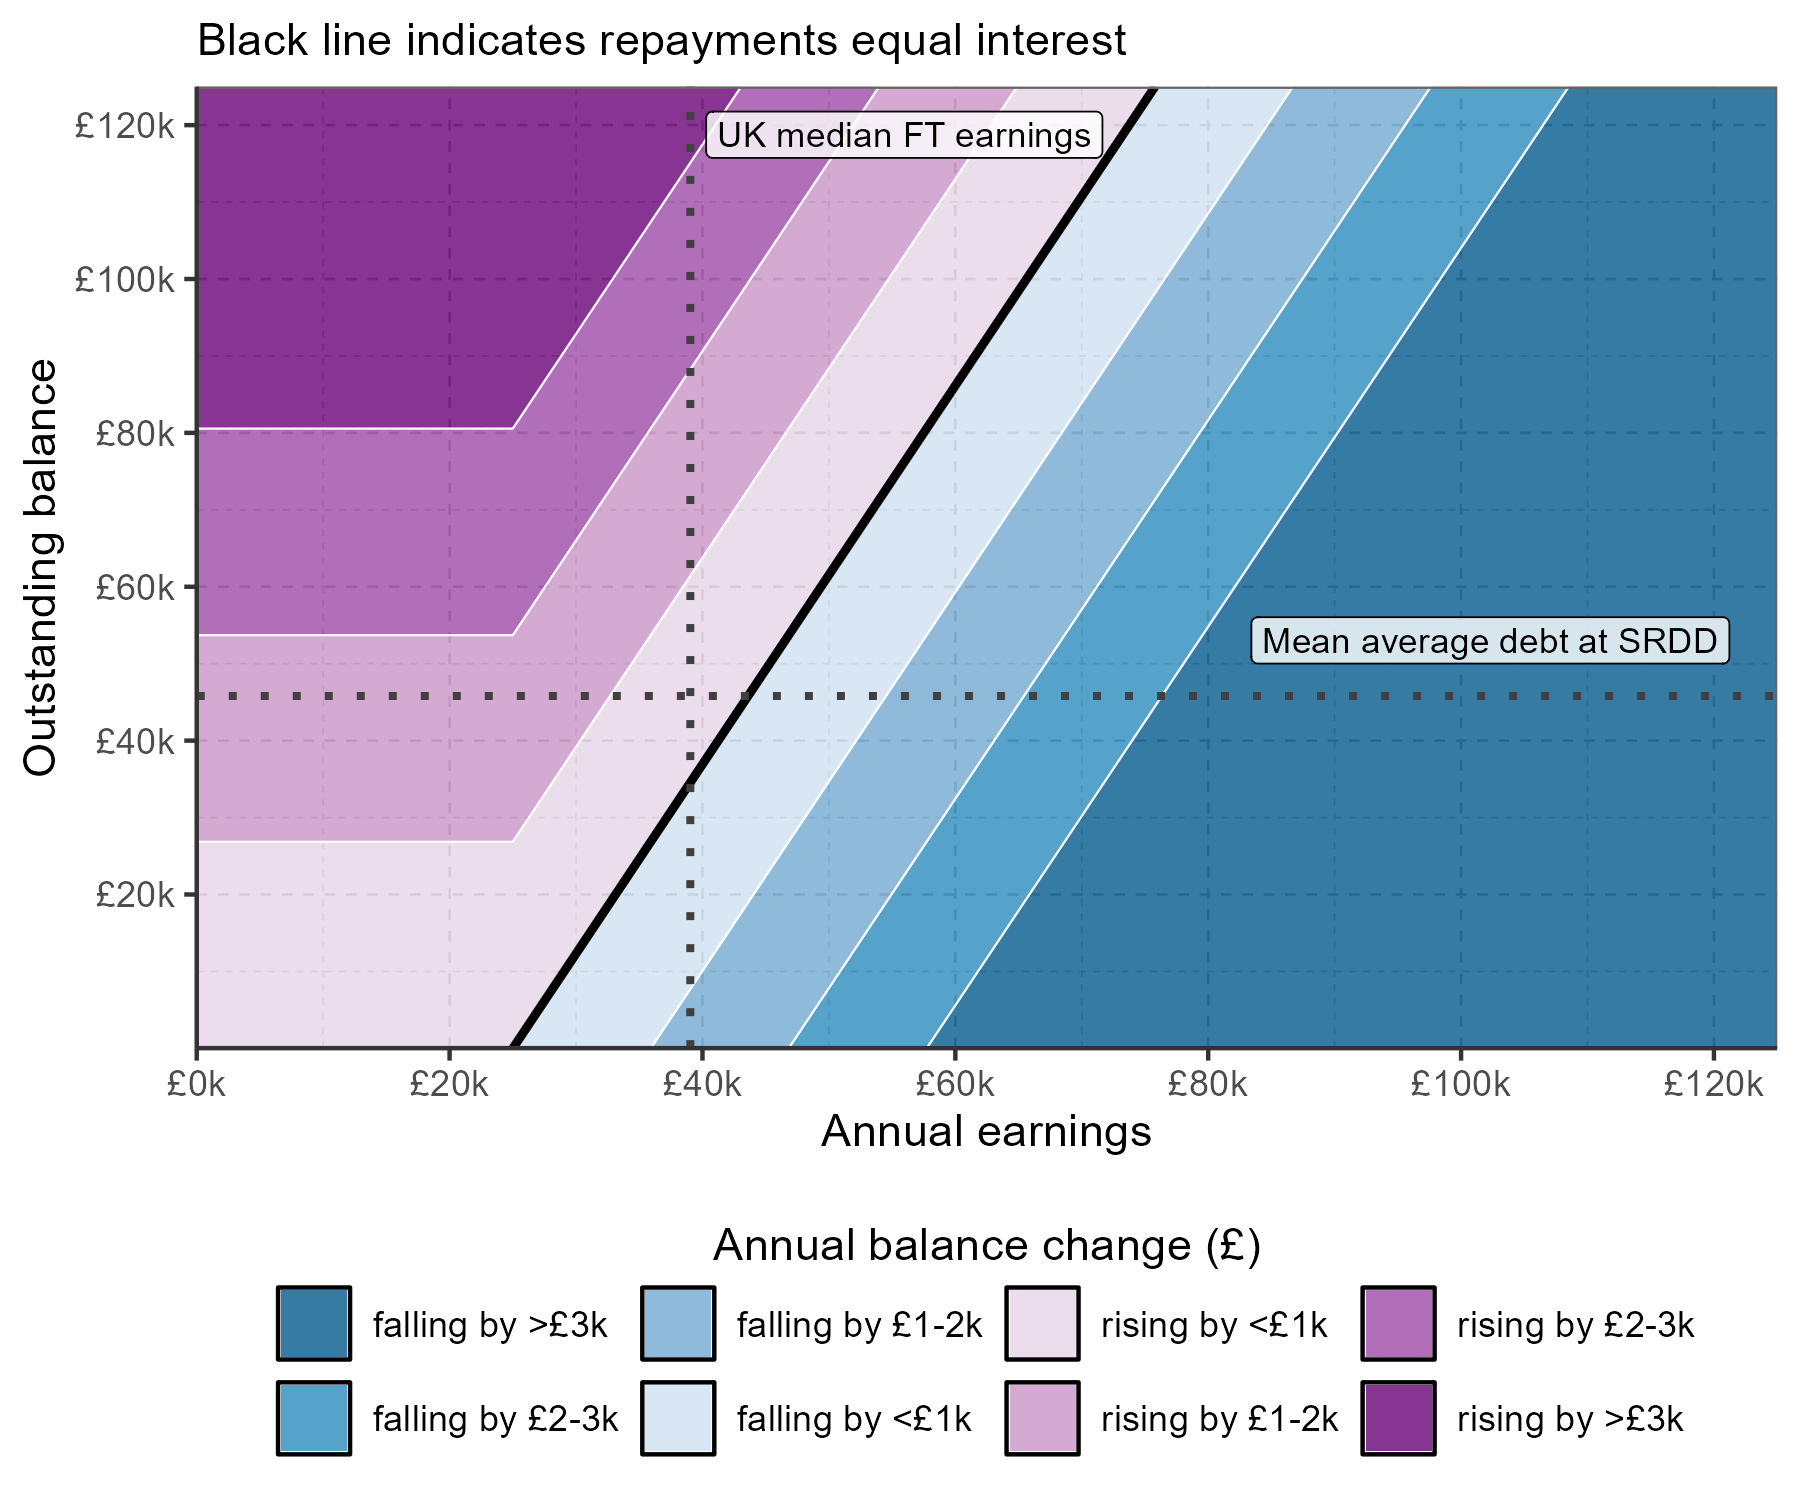
Figure 1.2 shows that a borrower with a loan balance of £45,800 (the forecasted mean average debt at SRDD for a Plan 5 borrower who started their course in academic year 2025/26), earning the UK’s median average salary for full-time employees in financial year 2025-26 of £39,039 (Employee earnings in the UK - Office for National Statistics (opens in new tab)), would see their loan balance increase by £419 per year. The lower interest rates charged on Plan 5 loans than Plans 2 and 3 lead to steeper gradients in Figure 1.2. This is because the annual earnings required for repayments to exceed interest accrued given an outstanding balance are lower for Plan 5 than for Plans 2 and 3.
Figure 1.3: Change in outstanding loan balance based on annual earnings for Plan 3 borrowers in financial year 2026-27
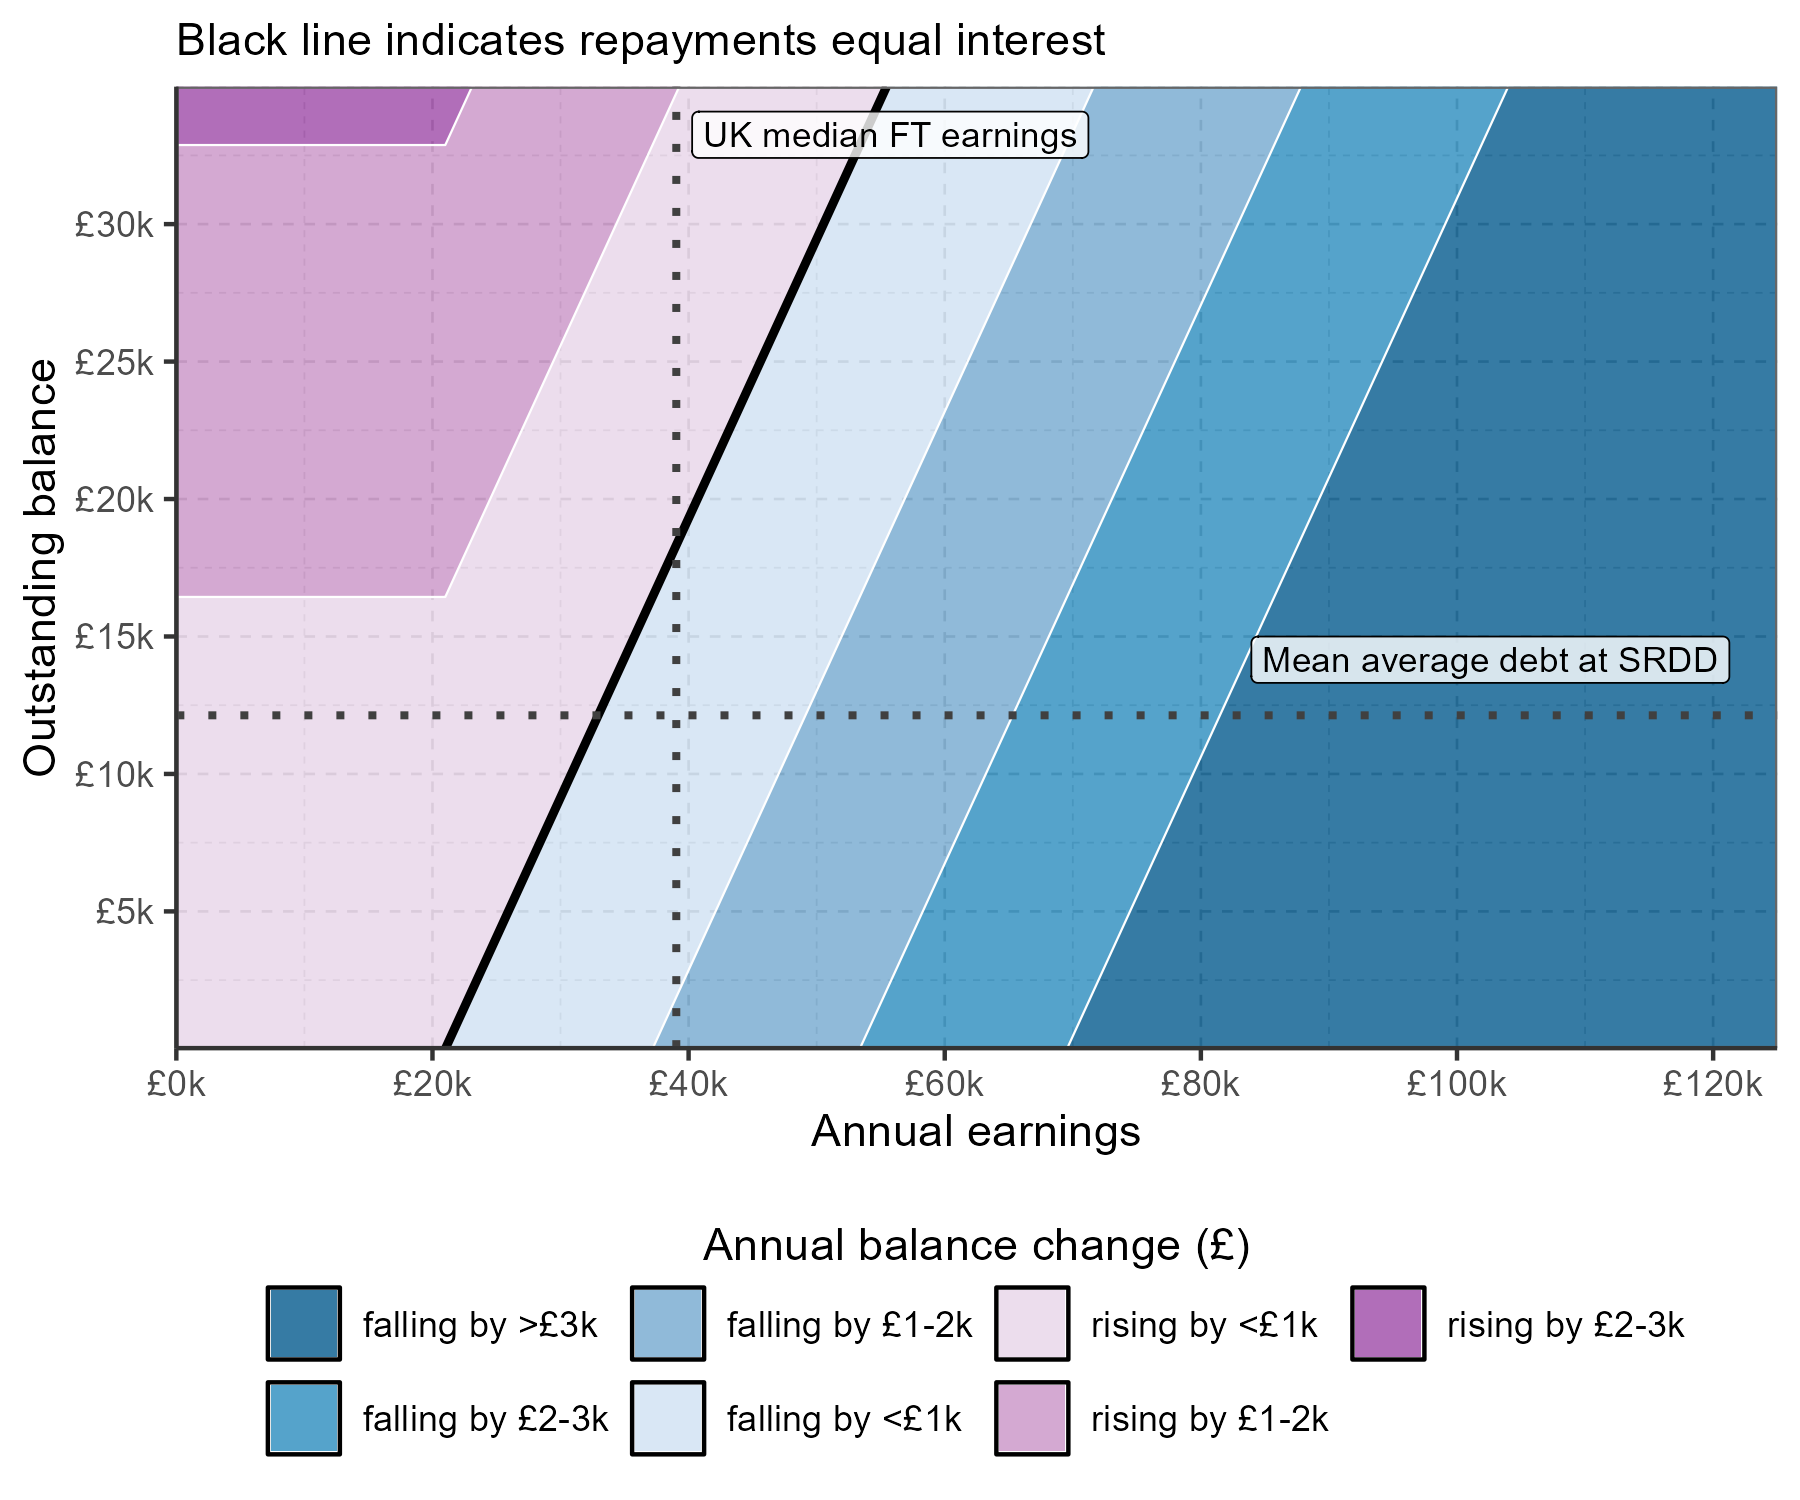
Figure 1.3 shows that a borrower with a Plan 3 loan balance of £12,100 (the forecasted mean average outlay for Plan 3 borrowers in academic year 2025/26), earning the UK’s median salary for full-time employees in financial year 2025-26 of £39,039 (Employee earnings in the UK - Office for National Statistics (opens in new tab)), would see their Plan 3 loan balance decrease by £377 per year. Plan 3 repayments are lower due to the lower repayment rate of 6%, and interest rates are higher, so we see more combinations of earnings and balances leading to balances growing faster. Plan 3 loans are repaid in parallel with undergraduate loans so are considered separately here for the purposes of comparing interest accrual and repayments. Where a borrower holds both an undergraduate and a postgraduate loan, the charts reflect only what happens to the balance for each loan individually.
To note: Most Plan 3 loan balances relate to Master’s courses. From the Student Loans Forecasts publication, the average Plan 3 total outlay without added interest at SRDD was £12,100 in academic year 2025/26.
Table 1.4 presents the calculated monthly repayments made based on a given annual salary for each plan type for financial year 2026-27. This shows that:
- A borrower with both an undergraduate and a postgraduate loan (e.g. Plan 2 and Plan 3 loan, or Plan 5 and Plan 3 loan) will repay more per month than a borrower earning the same amount with only one plan type. This is because postgraduate and undergraduate loans are repaid concurrently.
- A Plan 5 borrower will see slightly higher monthly repayments, compared to a Plan 2 borrower with the same annual earnings. This is due to the repayment threshold being lower for Plan 5 than Plan 2.
To note: Borrowers with multiple undergraduate loans, even if they are of different plan types, will not make greater monthly repayments than they would if they held only one loan. Their total obligatory repayments will be 9% of earnings above the lower of the thresholds associated with the plan types of their debt, with repayments allocated to loan balances per plan type in line with published rules (Repaying your student loan: How much you repay - GOV.UK) (opens in new tab)).
Proportion of borrowers forecasted to fully repay their student loan, across earnings bands
The analysis presented in this section sets out the proportion of Plan 2 and Plan 5 undergraduate loan borrowers, within defined annual earnings bands, expected to fully repay their loan at 3, 5 and 10 years after SRDD.
A borrower’s earnings are likely to change over the repayment period, affecting the ability of the borrower to fully repay their student loan.
This table shows the proportion of student loan borrowers forecast to fully repay based on earnings 3, 5 and 10 years post SRDD in financial year 2025-26 terms by plan type. Based on Plan 2 borrowers starting their course in academic year 2022/23 and Plan 5 borrowers starting their course in academic year 2025/26.
Table 2.1 shows that:
- For a given earnings band, typically the proportion of Plan 5 borrowers forecast to fully repay is higher than Plan 2 borrowers in the same earnings band. This reflects the higher rate of interest accrual, higher repayment threshold and shorter repayment term of Plan 2 borrowers.
- 46% of Plan 5 borrowers in the lowest earnings band three years after SRDD are forecast to fully repay their loans.
To note: The borrowers presented within Table 2.1 are within the subpopulation as outlined in the Key Limitations and Methodology Notes section, focussing on younger borrowers who borrow for three years. Earnings are normalised to financial year 2025-26 prices using OBR earnings growth forecasts.
The lowest earnings bands have decreasing proportions of borrowers expected to fully repay over time. Nearly 50% of Plan 5 borrowers earning £0-£10,000 three years after graduation are forecast to fully repay their loans, showing that low earnings soon after graduation is a fairly weak predictor of earnings across the borrower’s entire repayment period.
The proportion forecast to fully repay is higher at every earnings band, at each given year after SRDD, for Plan 5 borrowers than Plan 2 borrowers due to Plan 5 terms. This does not necessarily mean that Plan 5 borrowers make more repayments in every earnings band. The higher interest rates charged for Plan 2 loans mean some borrowers will repay more than they borrower in real terms (discounted by RPI) but still not fully repay their loans, whereas a Plan 5 borrower won’t repay more in real terms than the amount they borrowed.
Widths of earnings bands in this analysis vary due to lower numbers of borrowers in the sample in certain bands.
The next section explores the variability in earnings pathways across borrowers.
Illustrative borrower earnings pathways and impact on student loan balance
Many borrowers’ earnings are likely to vary across their repayment period, with earnings fluctuating below and above the repayment threshold. This non-smooth earnings trajectory (or borrower earnings pathway) influences a borrower’s outstanding loan balance.
To help demonstrate this, the analysis presented in this section shows three different illustrative borrowers, and how their student loan balance varies as their earnings vary over time. These three borrowers have a similar closing balance at SRDD and are from the subpopulation as outlined in Key Limitations and Methodology Notes section.
Figure 3.1: Earnings and loan balance for Plan 5 borrowers starting their course in 2025/26 with different breaks in earnings across the repayment period.
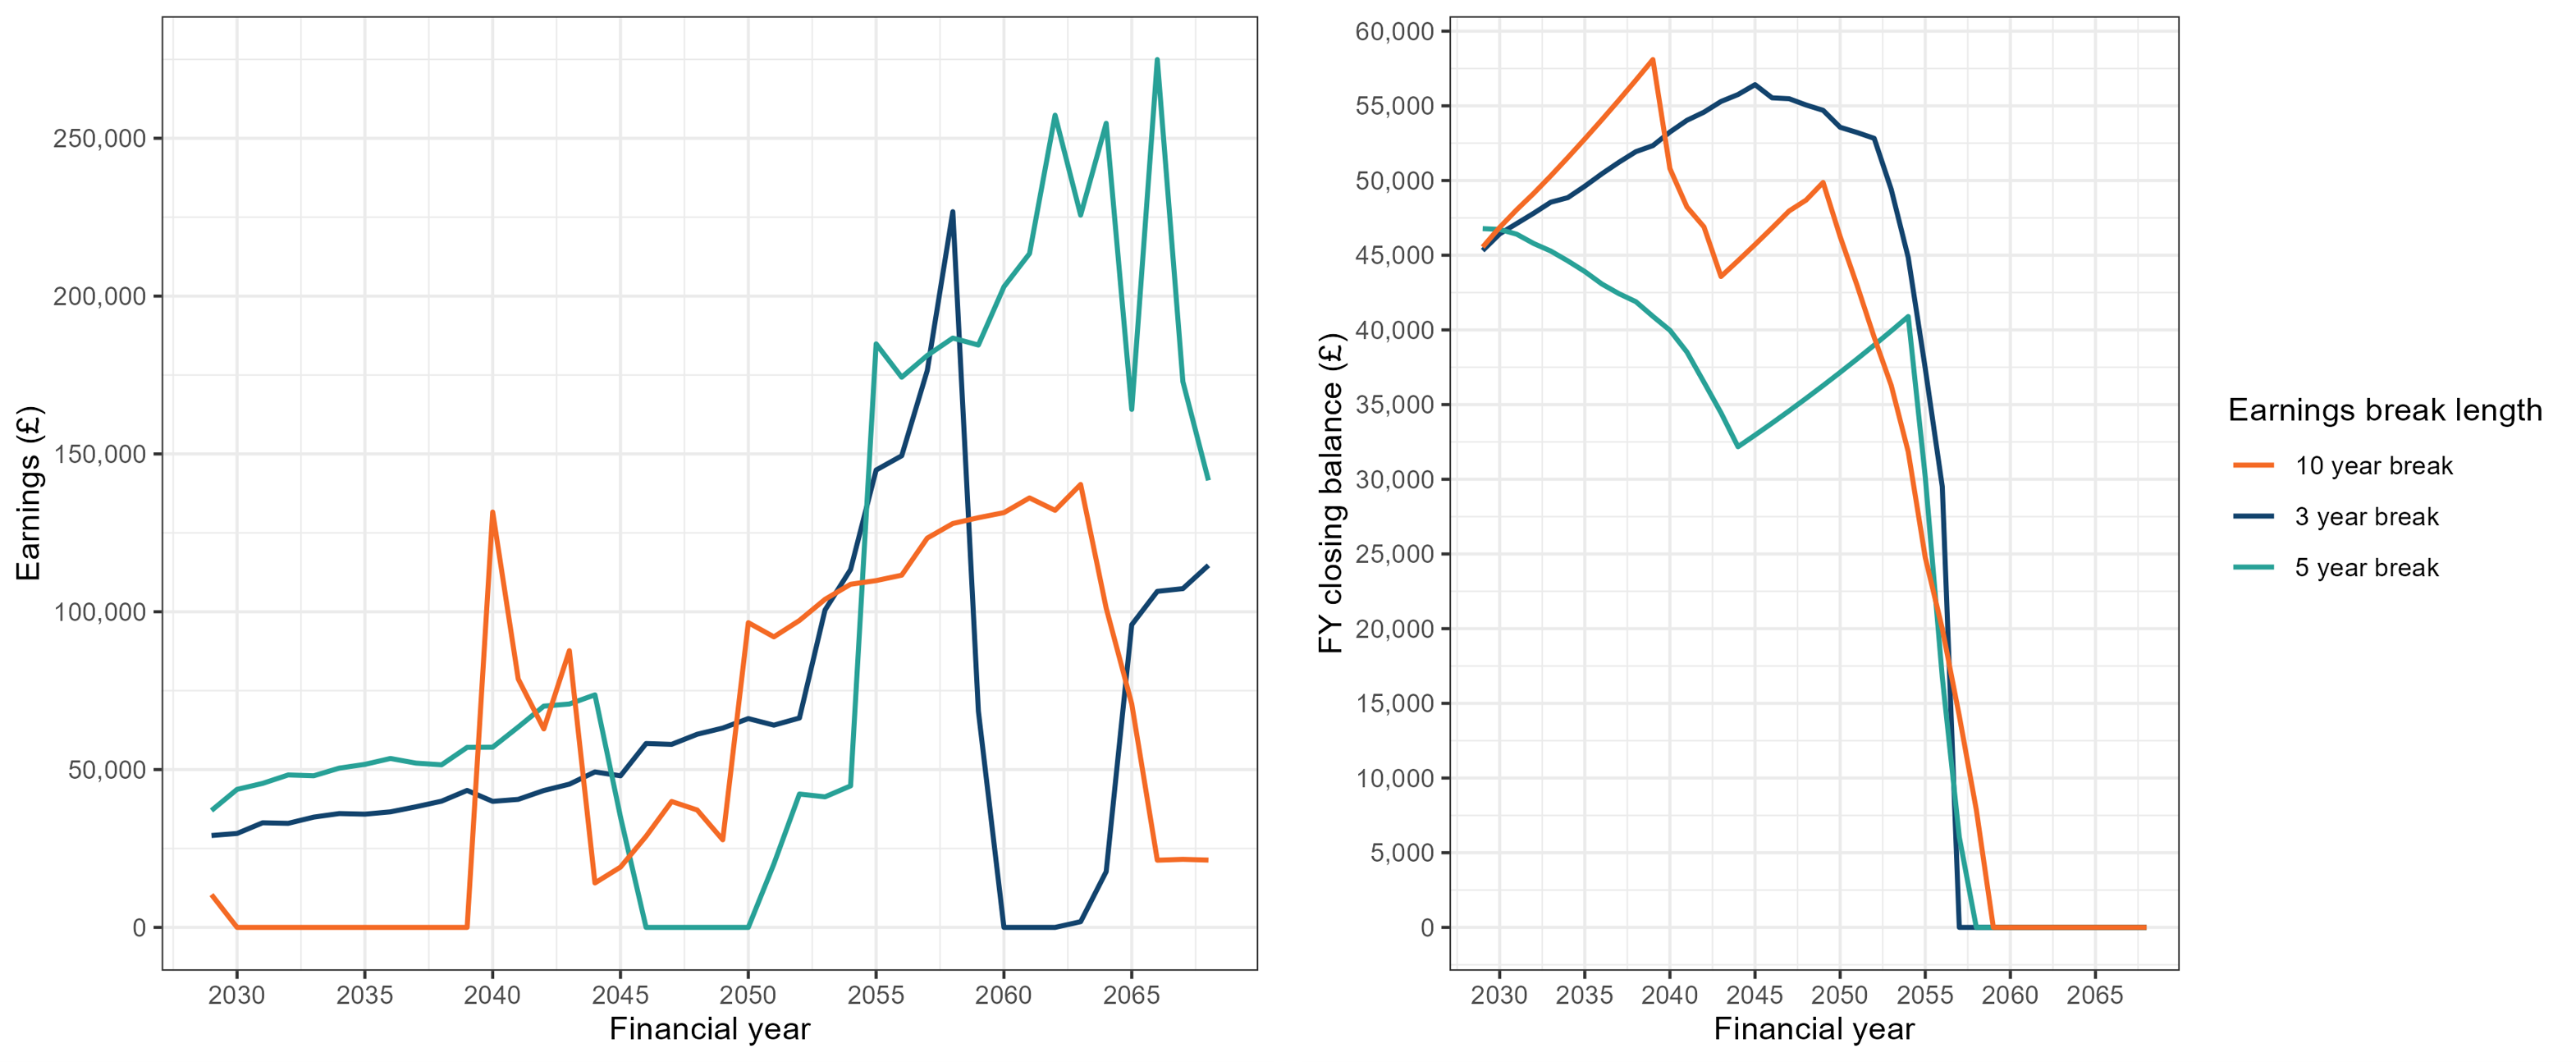
Figure 3.1 presents the earnings pathway (each including a break in earnings at some point within the repayment period) and closing loan balance of three illustrative Plan 5 borrowers over the repayment term of 40 years from SRDD.
Figure 3.1 shows that despite having different earning pathways and earnings breaks of different lengths, all three illustrative borrowers are forecasted to repay their student loan in full within different financial years across the repayment period:
- One borrower has a break in earnings of three years late on in their repayment period, so they fully repay before dropping below the repayment threshold.
- A second borrower has a five-year break in earnings in the middle of their repayment period so sees their debt grow in the middle of their repayment period, but still completes repayments due to higher late career earnings.
- The third borrower has a longer, 10-year break in earnings at the start of their repayment period but earns well enough, consistently enough to still fully repay.
The borrower who takes a three-year earnings break sees their earnings gradually increase and peak around the time where their outstanding loan balance reaches zero .
The borrower who takes the five-year earnings break sees their balance decrease at the beginning of the repayment period as they start on high earnings. They then take their earnings break in the middle, leading to their balance increasing during this period. Following their earnings break, their earnings climb substantially leading to their balance decreasing and reaching zero.
The borrower taking the 10-year earnings break does so at the beginning of the repayment period so sees their balance climb. Their earnings then drop slightly, after a sharp increase, leading to a period of increase in outstanding balance. Their earnings then gradually climb, reducing their loan balance and reaching zero. This borrower takes the longest to fully repay as their earnings never reach as high as the other two borrowers and the length of their earnings break means they have the greatest increase to their loan balance at the beginning of the repayment period.
Key limitations and methodology notes
The results in multiple sections of this publication use the same modelling as the annual forecast publication (Student loan forecasts for England: methodology - Explore education statistics - GOV.UK). The models used are designed specifically for forecasts feeding into accounting calculations – analysing earnings projections is an extension of the models’ scope. As such there are some limitations in using the modelling for this purpose:
- Career earnings pathways are based on historical data. We do not make any assumptions about potential future changes to career paths. The nature of our earnings model means scenario-based analysis looking at structural employment changes is not feasible and beyond the model scope.
- Economic assumptions are taken from the Office for Budget Responsibility’s Economic and Fiscal Outlook. Long-term projections are based on a level of stability, with earnings growth exceeding inflation for every year of the long-term forecast. This is suitable for government finance calculations but is not reflective of a reality where, even with sustained growth, disruption and black swan events are inevitable at a frequency that will affect these forecasts.
- Forecasts are based on current policies. Any future change to repayment policy beyond current rules is not considered.
- Earnings pathway modelling has been shown to perform well when measured at the whole population scale. The forecasts presented here are more reliant on individual-level pathways, which over whole careers may be more sensitive to some model assumptions that are reasonable on the population scale.
- We deliberately focus on a subset of the borrower population to make findings easier to interpret. In reality, the borrower population is highly diverse.
The deterministic modelling used in Earnings Required to Reduce Loan Balances section should be considered as indicative only – it shows potential routes to repayment but smooth earnings pathways through entire careers are only a small part of the picture. Individual-level earnings matching population-wide earnings growth would be highly uncommon, but a useful demonstration of individual-level dynamics. Additionally, this simplified deterministic model contains no predictions of changing earnings levels, undertaking further study, voluntary repayments, self-employed earnings, oversees earnings or death, which our main forecast model does. In reality, these borrower behaviours mean it is extremely unlikely that any student loan balances would follow these deterministic paths, and they should in no way be used by borrowers to extrapolate their future repayments or balances.
While the deterministic model is relatively simple and has been thoroughly assured, it is not subject to the same level of scrutiny as the core model used for the Department’s financial forecasts.
Borrower population
Student loan borrowers form a highly diverse population, which creates challenges in presenting statistics without the broad range of loan recipients obscuring the underlying trends.
Within this report, analysis that is based on the Department’s core student loan forecast modelling focuses on a subpopulation of borrowers:
- A single start academic year depending on the plan being analysed. This is 2022/23 for Plan 2 and 2025/26 for Plan 5 so earnings are comparable within each cohort.
- Full-time undergraduates only.
- Single period of study. Borrowers may take multiple courses, for example an undergraduate degree followed by a PGCE postgraduate teaching course (which are eligible for undergraduate loans). We focus on borrowers with only one course to avoid complicating interpretations, with some repeat borrowers having higher borrowing and some having loans on multiple plan types.
- Three-year courses only, i.e. filtering on borrowers who become liable to make repayments at their SRDD in 2029 for Plan 5 borrowers starting their course in 2025 and SRDD in 2026 for Plan 2 borrowers starting their course in 2022, to avoid complications around substantially differing loan balances. We would expect a lower proportion of loan to be repaid among borrowers taking longer courses and more borrowers to fully repay if they have studied for a shorter period of time.
- Age 22-25 at SRDD. This captures borrowers who undertake higher education soon after leaving school, allowing for deferments and gap years, and excludes borrowers whose repayment period extended into retirement.
- Students domiciled in England only.
- No mortality. We filter out borrowers the model forecasts as dying before the end of their repayment term. This is primarily to ensure a consistent comparison across borrowers of lifetime repayments.
Overall, this means we are presenting analysis relating to borrowers who take full degrees soon after completing A levels, take on a typical amount of debt and don’t die in the model during their earning period.
In the core model used for producing student finance forecasts we have 452,500 full-time Plan 5 borrowers with a course start year of 2025/26. With these filters applied, this reduces to 78,300 borrowers, which we use here for the analysis of the proportion of borrowers expected to fully repay.
The analysis in this publication is not comparable with forecasts presented in Release home - Student loan forecasts for England - Explore education statistics - GOV.UK due to the filters used.
Figure 4.1: Number of borrowers in the sample after filters are applied
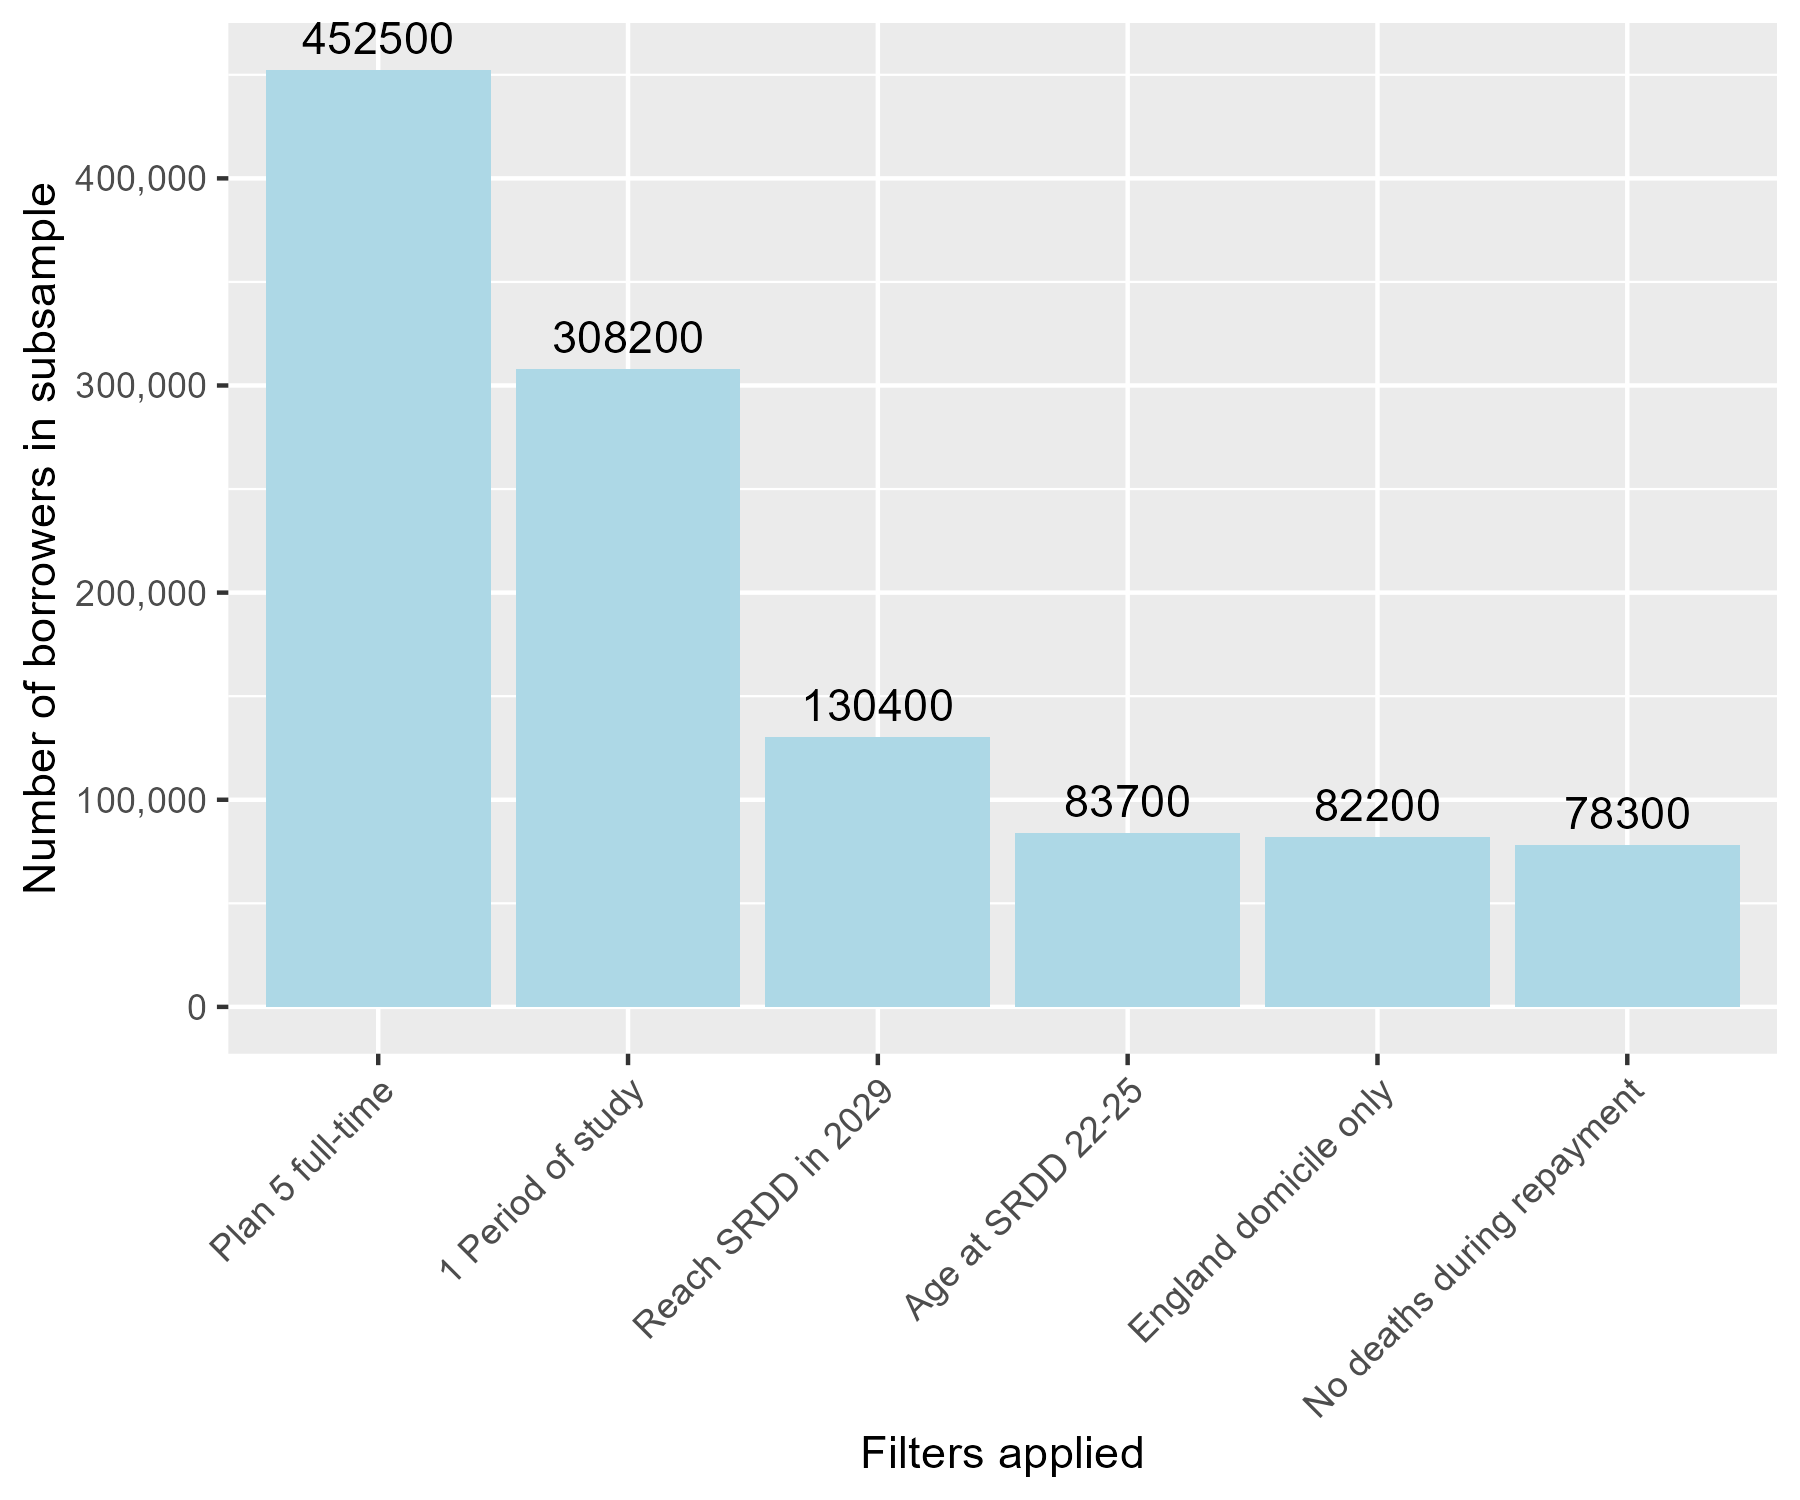
Figure 4.1 displays the reduction in Plan 5 borrowers who started in academic year 2025/26 as a result of each filter being applied. The number of borrowers has been rounded to the nearest hundred.
Table 4.2 shows the historical total numbers of Higher Education student loan borrowers by plan type as at the end of each financial year, as extracted from SLC record-level data. These figures should be considered as the definitive source for borrower numbers per plan type.
In most cases there are more borrowers per plan type, per year as the borrower population grows – more borrowers take their first outlay than have their loan balance written off or fully repay. The Plan 1 borrower population shrinks throughout because no more new borrowers were eligible to take Plan 1 loans after academic year 2011/12. Likewise, the Plan 2 borrower population falls from financial year 2023-24 as new borrowers began receiving Plan 5 loans.
Contact us
If you have a specific enquiry about Student loan forecasts - earnings statistics and data:
Higher Education Analysis
Email: he.modelling@education.gov.ukContact name: Tony Carter
Press office
If you have a media enquiry:
Telephone: 020 7783 8300
Public enquiries
If you have a general enquiry about the Department for Education (DfE) or education:
Phone: 0370 000 2288
Opening times
Monday to Friday from 9.30am to 5.30pm (closed on bank holidays)