National pupil projections
Annual release providing national projections for the number of pupils in schools in England by type of school, age and whether full time or part time.
Quick links
Next release
All releases in this series- Published
- Last updated
Headline facts and figures
Background information
This annual release provides national projections for the number of pupils in schools in England by type of school and age.
These statistics are calculated based on the Office for National Statistics (ONS) population estimates and projections, monthly birth registration data up to and including 2024, and school census data up to and including January 2026.
The pupil projections use the most recent ONS data available:
- ONS population estimates (opens in new tab), which this year includes revised 2022 and 2023 data
- ONS latest mid-2024-based projections (opens in new tab)
These mid-2024-based projections include updated long-term fertility and mortality assumptions, and alternative scenarios (variant projections). These ONS projections assume lower long-term international migration and lower future fertility than in the previous (2022-based) national population projections.
The latest long-term international migration provisional release for the calendar year ending December 2025 indicated long-term net migration is down by almost 50% compared with last year. This follows a 50% reduction seen in the year ending June 2024 (compared with the YE June 2023).
For more information, please see the methodology document.
Due to the increased uncertainty in long-term net migration assumptions, pupil projections in this release continue to be published only five years into the future (up to 2031) rather than ten years (up to 2036) as was the case in previous years. There are some comparisons with 2030 because the previous projections only projected to that year due to increased uncertainty in longer-term fertility assumptions at that time.
National pupil projection results and comparison to previous model results
Comparison of the results from the 2025 and 2026 pupil projection models
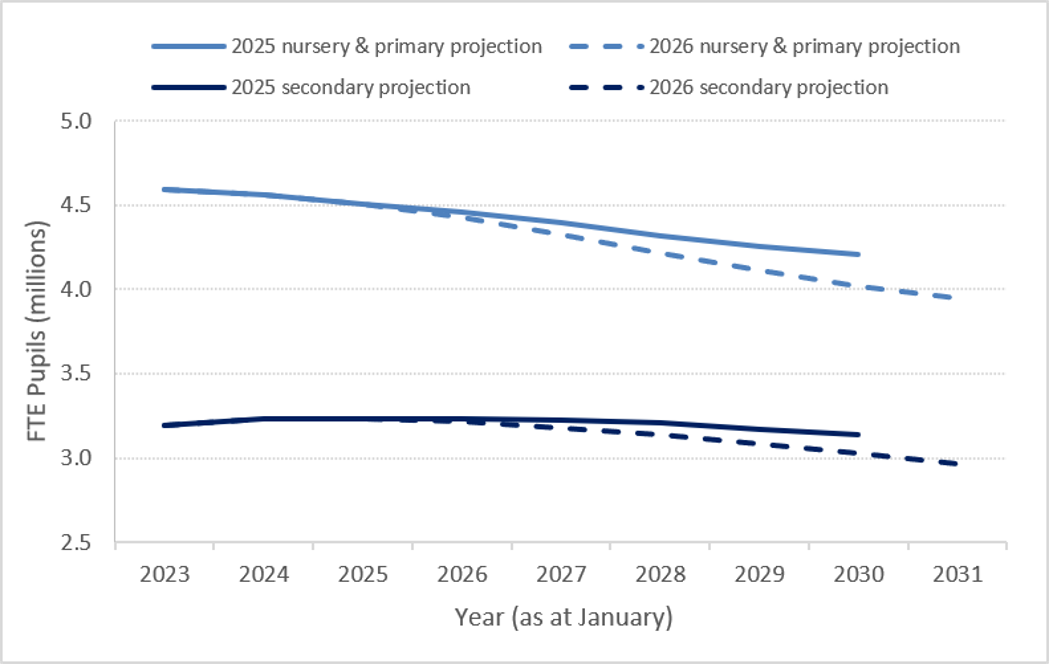
- In 2026, the actual population in state-funded schools[1] (opens in a new tab) was 7,809,000. By 2031, the population is projected to decrease by 726,000 (9.3%) to 7,082,000.
- Figures are reported as full-time equivalent (FTE) and cover all ages up to 15 unless specified otherwise.
- The 2025 national pupil projection model (opens in a new tab) showed a state-funded school population of 7,504,000 by 2030 (down 5.0% from 2025). The current model, still showing a decline, projects a population of 7,217,000 by 2030 (down 8.6% from 2025), which is 286,000 (3.8%) fewer pupils than the previous projection for 2030.
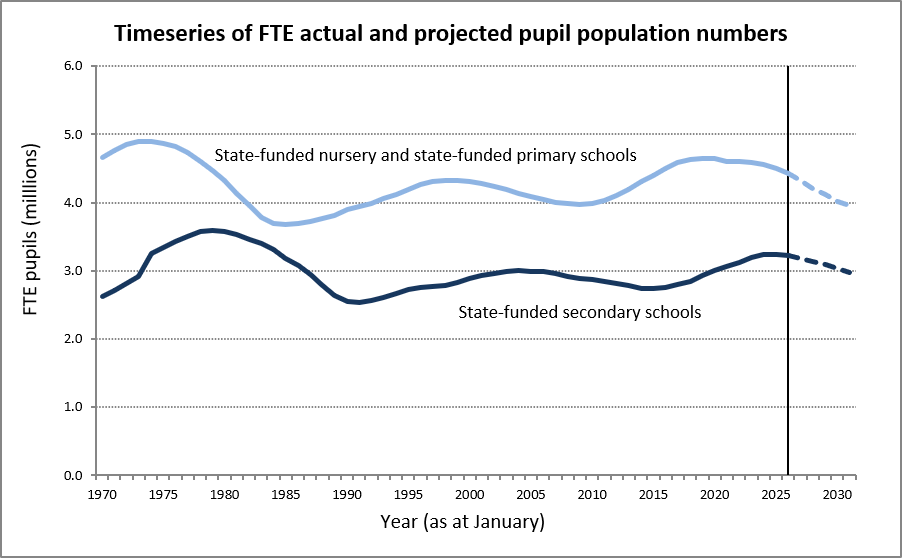
- The latest figures from the January 2026 school census showed that there was a decrease of 112,000 (1.2%) pupils across all school types, and all ages up to 19, from the previous year. There are fewer pupils in state-funded primary, secondary and alternative provision schools this year compared with last year. This is primarily driven by demographic changes, following a peak of births in 2012, as children reach secondary school age and lower numbers of pupils are moving into primary school age. The number of pupils in state-funded and non-maintained special schools has increased by 4.8%, to 178,000, continuing the trend of increases seen in recent years.
- Due to the increased uncertainty in migration assumptions, the projections in this release are only provided up to 2031. This is a continuation of the practice from the last two publications which moved away from projecting ten years ahead. The 2024 publication only provided projections up to 2028 due to the increased uncertainty in fertility assumptions from 2029 onwards. Similarly, the 2025 publication only provided projections up to 2030 due to the emerging uncertainty in migration.
Historical and projected pupil numbers (up to and including age 15 at the start of the academic year) by main school type, England
Early years
- Early years calculations include 4-year-olds in reception class, which almost all children attend, as well as the younger ages where participation in the state-funded sector is much smaller and there are more part-time pupils.
- The FTE population of under 5-year-olds in state-funded education is projected to be 714,000 in 2031. This is a 10.4% decrease from the actual figure for 2026 (797,000).
- This projected population decrease is due to lower total live births in 2023 and 2024, which ONS projects will continue up to and beyond 2031 as presented in this publication. Compared with the 2025 projection, which projected a 4% (32,000) decrease in 5-year-olds between 2025 and 2030, the latest projection shows a faster decrease of 11.1% (89,000) over the same period. One reason for this could be ONS’s latest migration assumptions which now project fewer women of childbearing age and lower fertility rates than previously projected.
State-funded nursery and primary schools
- The overall pupil population in these school types is projected to be 3,951,000 in 2031. This is 473,000 (10.7%) lower than the actual population in 2026 (4,424,000).
- The revised projection for 2030 of 4,021,000 pupils represents a 10.7% fall from 2025; compared with the previous forecast this is 184,000 (4.4%) lower as last year’s projections only projected a 6.7% fall over the same period.
- The nursery and primary population is therefore still projected to drop and is doing so at a faster rate than previously projected.
State-funded secondary schools
- The secondary school population is projected to be 2,967,000 in 2031. This is 249,000 lower than the actual school population reported in the 2026 school census of 3,216,000.
- The revised projection for 2030 of 3,029,000 secondary pupils represents a 6.3% fall from 2025 and is 106,000 (3.4%) lower than last year’s projections which only projected a 3% fall over the same period.
- The pattern of change in the secondary school population seems to indicate that it plateaued between 2024 and 2025, and has started to decline slowly.
- The actual number of secondary school pupils in 2026 fell slightly as more pupils moved out of the secondary phase than moved in. Changing historical birth rates and trends in net migration are likely driving factors.
Actual (2026) and projected pupil numbers by school type, England (thousands)
| 2026 | 2027 | 2028 | 2029 | 2030 | 2031 | ||
|---|---|---|---|---|---|---|---|
| State-funded nursery & primary schools | 4,424 | 4,321 | 4,211 | 4,111 | 4,021 | 3,951 | |
| year-on-year change | -103 | -110 | -100 | -90 | -70 | ||
| State-funded secondary schools | 3,216 | 3,179 | 3,140 | 3,085 | 3,029 | 2,967 | |
| year-on-year change | -37 | -39 | -55 | -56 | -62 | ||
| State-funded special schools | 153 | 155 | 154 | 153 | 150 | 148 | |
| year-on-year change | 2 | -1 | -1 | -3 | -2 | ||
| Alternative provision settings | 16 | 17 | 17 | 16 | 16 | 16 | |
| year-on-year change | 1 | 0 | -1 | 0 | 0 | ||
| Total state-funded schools | 7,809 | 7,671 | 7,522 | 7,365 | 7,217 | 7,082 | |
| year-on-year change | -138 | -149 | -157 | -148 | -135 | ||
Components of change
There are several elements that affect the results of the projections. The key elements, and how they affect the results, are detailed below.
Births
- The number of births feeds directly into the projections but also affects how births are projected in the future.
- The birth rate increased for over a decade until 2012, after which it dropped notably. Birth rates have been generally dropping ever since, except for slight rises in 2021 and 2024, with 2025 recording the second lowest number of births since 1977.
- The fertility assumptions used by ONS in the production of their mid-2024 population projections have been updated and the projected total fertility rate is lower than in previous rounds of projections.
Participation rates
- These are calculated based on the number of pupils attending school (from the school census) measured against the total population figures.
- It is therefore important to use population estimates and projections that reflect the overall population size based on the 2021 Census results.
- The participation rates are particularly important in the early years. Parents can choose whether to send their children aged under 5 to a school setting instead of, or in conjunction with, formal or informal childcare.
- The participation rates for each school type are projected and then used as the basis of the calculations of projected numbers.
- These rates are affected by any unusual patterns in the underlying total population or the school census data. For example, the large drop in the number of children recorded as attending state-funded alternative provision in 2021 (18% lower compared with the 2020 school census) would have reduced the participation rate for that school type significantly in that year.
- Recent data from the school census showed that in January 2026 there was a decrease of around 112,000 pupils across all schools and all age groups up to 19 compared with the same period last year. This is primarily driven by demographic changes rather than pupils leaving state education for other settings. The large birth cohort from 2008 to 2012 has started to move out of the secondary phase and we have continually seen lower numbers of pupils moving into the primary phase.
Immigration
- Direct immigration of pupils born outside the UK historically has only had a small effect on the school-age population. However, the latest estimates of long-term net migration (December 2025) fell by 50% compared with the same period last year and are likely to be a contributing factor in the fall in pupil numbers reported in the 2026 school census. As ONS noted in their publication (opens in new tab), recent policy reforms by the Home Office have led to a decrease in work-related and study-related immigration which, for example, restricted most overseas students from bringing family members to the UK.
- Migration can have a larger effect on the birth rate, as historically fertility rates are reported to be higher for women who are resident in the UK but were born outside the UK. For more information on this, see the methodology section.
Source data
These pupil projections have been produced using ONS rebased population estimates that take account of the 2021 Census, the latest 2024 updates (which include post-2021 revisions) and mid-2024 population projections.
The ONS population projections which form the basis for these pupil projections are created using assumptions of the level of future fertility, migration and life expectancy. However, there are uncertainties in the calculation of these components. As such, ONS produces several projections (called variants) based on alternative assumptions.
The National Pupil Projections are produced using the principal projection variant, in line with the ONS national population projections and because of the uncertainty around future migration. The table below shows the effect of key alternative variant projections on the pupil projections, and further data is available as part of this release.
Note the primary age projections are most affected because the fertility changes feed into the lower age ranges more quickly.
population in 2031 | difference to principal | |||
|---|---|---|---|---|
| Projection | nursery & primary age | secondary age | nursery & primary age | secondary age |
| principal | 4,083 | 3,000 | ||
| low fertility | 4,059 | 3,000 | -24 | 0 |
| high fertility | 4,106 | 3,000 | 23 | 0 |
| low migration | 4,038 | 2,977 | -45 | -23 |
| high migration | 4,164 | 3,040 | 81 | 41 |
| low population | 4,014 | 2,977 | -68 | -23 |
| high population | 4,187 | 3,040 | 104 | 41 |
| Source: national population projections (2024 model). Figures are in 000s Nursery and primary age: pupils aged up to 10 Secondary age: pupils aged 11 to 15 | ||||
Further information
More information on the school census data, which forms the start of the pupil projection model, can be found in the publication ‘Schools, Pupils and their Characteristics’ published on Explore Education Statistics (EES).
More information on the source data used in the production of this projection can be found in the methodology document.
Contact us
If you have a specific enquiry about National pupil projections statistics and data:
Pupils and School Finance team
Email: PupilPopulation.PROJECTIONS@education.gov.ukContact name: Dexter Roberts
Press office
If you have a media enquiry:
Telephone: 020 7783 8300
Public enquiries
If you have a general enquiry about the Department for Education (DfE) or education:
Phone: 0370 000 2288
Opening times
Monday to Friday from 9.30am to 5.30pm (closed on bank holidays)